Indicator 9: Literacy rates
| Indicator is fully reported? |
Information is held about people from 16-65. No information is available about literacy rates for people aged 66 years or older. |
| Type of indicator |  Outcome indicator Outcome indicator |
| Other relevant indicators |
Limited information is published in five-year age groups from 16 to 65 years from the results of the International Adult Literacy Survey (IALS). Information from The Adult Literacy and Life Skills (ALL) Survey is published in 10-year age groups from 16-65 years. Note: depending on sampling errors, different or finer age-group analysis could be completed and published. |
| Our findings |
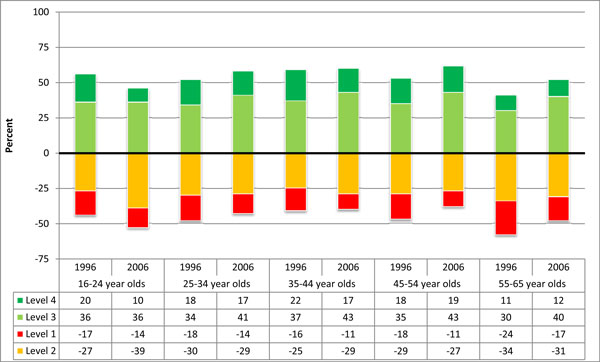
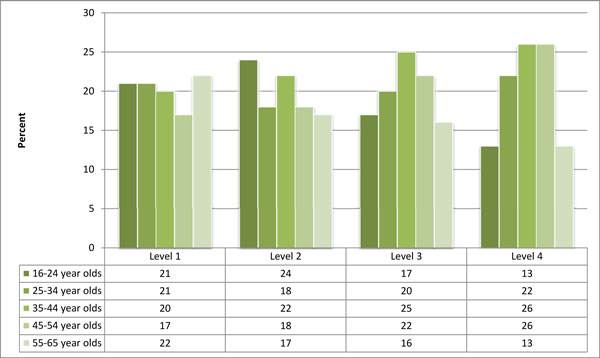
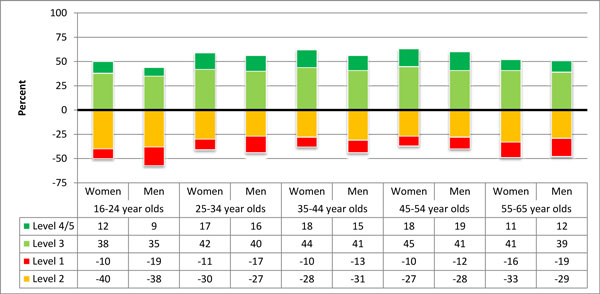
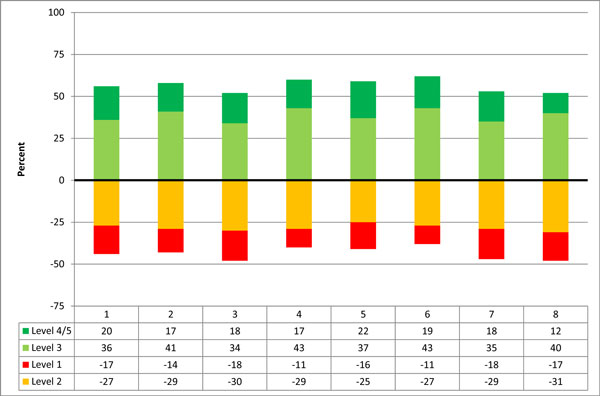
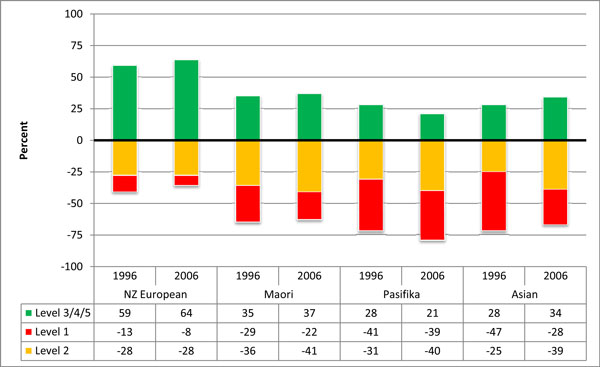
Literacy skills are critical tools for effectively coping within society and have a significant influence on “life chance” and people’s self-assessed health status and well-being. Adult literacy is a Tier 1 statistic in the Official Statistics System and will be updated 10-yearly.[1] The skill demands of a modern economy and society are becoming increasingly complex. If New Zealand is to maintain and enhance its position in the world economy, its adult population – including both women and men, and people with different ethnic backgrounds – needs to have high levels of generic and technical skills. In 1996, New Zealand participated in the IALS. It was the first comprehensive study of its type in New Zealand. The Ministry of Education considered that the survey provided an opportunity to benchmark against other comparable nations, establish a baseline from which to measure changes in the literacy skills of the population, to identify at risk and disadvantaged groups with low literacy and numeracy skills, and to assist in setting strategic direction aimed at addressing skill needs of the population.[2] Results were published in summary form but data tables were not published. Since 1996, the Ministry has published 33 reports about literacy in New Zealand and comparisons with other countries.[3] Assessing prose literacy Different types of literacy can be assessed (see 2006 ALL Survey results below). For this indicator, we examined the results for prose literacy. Prose literacy is ranked on a scale from 1-5, with level 1 representing a low level of literacy and level 5 representing a high level of literacy. More information about the levels is provided in Figure 6 at the end of this document. 1996 IALS results The proportion of people reaching higher levels of prose literacy (levels 3, 4, and 5) peaked in the 35-39 age group at about 60% and dropped to about 38% for the 60-65 age group. Only 25% of the older age group could locate and use information contained in documents at the higher levels; this was particularly low. Poorer literacy was concentrated within the non-European ethnic groups and people older than 39 years. The distribution of literacy skills within the population was similar to Australia and the USA but lagged dramatically behind Sweden, where nearly 75% of the population reached the higher levels of literacy needed to meet the demands of everyday life. 2006 ALL Survey results The Adult Literacy and Life Skills (ALL) Survey replaced the 1996 IALS. There were some differences between the surveys.[4] The ALL survey assessed prose literacy, document literacy, numeracy, and problem-solving in people aged 16-65 years. It provided an insight into current skill levels, which is essential for the development of initiatives to maintain and enhance these levels and reduce inequities.[5] A range of documents have been published reporting on the various aspects of the survey’s results. Comparisons were made with 1996 where possible. Data tables giving the overall prose literacy rates by ethnicity, age group, and gender have not been published. So far, the Ministry’s analysis has focused on one or two variables at a time. The survey found that self-assessed physical and mental/emotional well-being was higher at higher levels of literacy skill.[6] Literacy rate by age, 1996 and 2006 In both years, the overall prose literacy rate for people aged 55-65 was lower than for other age groups. However, the rate for the 55-65 year age group increased (see Figures 1 and 2). The people that were 45-54 years old in 1996 were aged 55-65 years in 2006. The prose literacy rate for this group increased for levels 1-3 and decreased for levels 4 and 5 (see Figure 4). Literacy rates by gender, 1996 and 2006 In both years, women had higher prose literacy skills than men for all age groups except 55-65 year olds. Within the 55-65 year olds, women and men had about the same skills (see Figure 3). Literacy rates by ethnicity, 1996 and 2006 In both years, the prose literacy skills of New Zealand European, Māori, and Asian ethnic groups increased or stayed relatively stable.[7] The skills of the Pasifika ethnic group decreased (see Figure 5). The report cautions that the 1996 statistics for Pasifika and Asian groups were of marginal quality. This problem recurred in the 2006 survey for Māori[8] and Pasifika[9] groups. Allowing for these issues, the Ministry reported that as the level of prose literacy skill increases:
The separate reports about literacy and life skills for Māori adults and Pasifika adults show that:
|
| Discussion |
The literacy levels of people aged 66 and older are unknown. For the population that has been surveyed, the quality of the prose literacy level data available to the Ministry of Education is poorest in the groups where the skill levels are the lowest. We consider that future surveys should ensure that the number of people surveyed is large enough to enable good-quality analysis in 10-year age groups by gender and ethnicity. The ALL survey was a once-only study. The successor to the IALS and ALL is the OECD’s Programme for International Assessment of Adult Competencies (PIAAC). New Zealand will participate in this study in 2014 and results will be available from 2016. Subject to sample size, the Ministry will consider reporting the results in five-year age groups instead of 10-year groups. It is also planning to oversample some groups (Māori, Pasifika, and people aged 16-25) for the 2014 survey. The Ministry will consider reporting separately on Asian literacy. However, this could be difficult to do because of the diverse nature of the population – it includes New Zealand-born people, immigrants, refugees, and a wide range of ethnicities. |
| How entities use the data |
Our low levels of literacy, language, and numeracy have been identified as contributing to our relatively low productivity.[15] The Ministry of Education has used data on adult literacy to identify needs for government action to improve literacy. Actions have included:
Priority is given to young people and people in the workforce. However, people aged 66 and older are not excluded from enrolling in courses or programmes (at work or in the community) to improve literacy and numeracy because of their age. From 1 January 2013, people aged 55+ are no longer eligible for living costs or course-related costs. However, they continue to be eligible for the compulsory fees component of the Student Loan Scheme.[20] The 2014 PIAAC survey will give a progress report on the effectiveness of the actions taken since 2006. |
| Entity responsible for this indicator |
The Ministry of Education (lead) helps determine the government’s literacy and numeracy policies. The Tertiary Education Commission is responsible for policy implementation and delivery of funds and programmes. Departments with an interest and/or role in adult literacy are the Ministry of Business, Innovation and Employment/Department of Labour, the Ministry of Social Development, Department of Corrections, Te Puni Kōkiri, Ministry of Pacific Island Affairs, and New Zealand Qualifications Authority.[21] |
Figure 1: Prose literacy rates for 16-65 year olds in 10-year age groups, 1996 and 2006
Note: Percentages are rounded to the nearest whole number.
Source: Ministry of Education (July 2008), The Adult Literacy and Life Skills (ALL) Survey: Age and Literacy, page 8, www.educationcounts.govt.nz.
Figure 2: Distribution of age by prose literacy skill level, 2006
Note: Percentages are rounded to the nearest whole number.
Source: Ministry of Education (July 2008), The Adult Literacy and Life Skills (ALL) Survey: Age and Literacy, page 9, www.educationcounts.govt.nz.
Figure 3: Prose literacy rates for 16-65 year olds by gender in 10-year age groups, 2006
Note: Percentages are rounded to the nearest whole number.
Source: Ministry of Education (July 2008), The Adult Literacy and Life Skills (ALL) Survey: Age and Literacy, page 19, www.educationcounts.govt.nz.
Figure 4: Prose literacy rates for 16-65 year olds by age cohort in 10-year age groups, 1996 and 2006
Note: Percentages are rounded to the nearest whole number.
Source: Ministry of Education (July 2008), The Adult Literacy and Life Skills (ALL) Survey: Age and Literacy, page 16, www.educationcounts.govt.nz.
Figure 5: Prose literacy rates by ethnicity, 1996 and 2006
Note:
- Levels 3, 4 and 5 are combined to give more robust statistical information.
- Robust statistics were unable to be generated for the ethnicity Other.
- The reported statistics for the IALS survey for the Pasifika and Asian groups are of marginal quality.
- Percentages are rounded to the nearest whole number.
Source: Ministry of Education (August 2008), The Adult Literacy and Life Skills (ALL) Survey: Gender, Ethnicity and Literacy, page 23, www.educationcounts.govt.nz.
Figure 6: Measuring an individual’s skills
Individuals are assigned a score from zero to 500 for each of the types of literacy. Zero indicates extremely low proficiency and 500 extremely high. In addition, based upon this score, one of five “cognitive levels” is assigned. The following list provides descriptions of typical tasks associated with each cognitive level.
| Level 1 (0–225) |
Tasks in this level require the ability to read simple documents, accomplish literal information-matching with no distractions, and perform simple one-step calculations. |
|---|---|
| Level 2 (226–275) |
This level includes tasks that demand the capacity to search a document and filter out some simple distracting information, achieve low-level inferences, and execute one- or two-step calculations and estimations. |
| Level 3 (276–325) |
Typical tasks at level 3 involve more complex information filtering, sometimes requiring inference, and the facility to manipulate mathematical symbols, perhaps in several stages. |
| Level 4 (326–375) |
A level 4 task might demand the integration of information from a long passage, the use of more complex inferences, and the completion of multiple-step calculations requiring some reasoning. |
| Level 5 (376–500) |
Level 5 tasks incorporate the capability to make high-level inferences or syntheses, use specialised knowledge, filter out multiple distractors, and to understand and use abstract mathematical ideas with justification. |
Source: Ministry of Education (2007), The Adult Literacy and Life Skills (ALL) Survey: Further Investigation (fact-sheet), www.educationcounts.govt.nz.
[1] Statistics New Zealand (16 October 2012), Tier 1 statistics 2012, www.statisphere.govt.nz.
[2] Ministry of Education (undated), Adult Literacy in New Zealand: Results from the International Adult Literacy Survey, www.educationcounts.govt.nz.
[3] As at 9 January 2013.
[4] Information about the survey is in Ministry of Education (August 2007), The Adult Literacy and Life Skills (ALL) Survey: An Introduction, www.educationcounts.govt.nz.
[5] http://www.educationcounts.govt.nz/publications/literacy/29875/1.
[6] Ministry of Education (March 2009), Well-being and education level: fact sheet, www.educationcounts.govt.nz.
[7] Ministry of Education (August 2008), The Adult Literacy and Life Skills (ALL) Survey: Gender, Ethnicity and Literacy, www.educationcounts.govt.nz.
[8] Ministry of Education (August 2009), Literacy and Life Skills for Maori Adults: Results from the Adult Literacy and Life Skills (ALL) Survey.
[9] Ministry of Education (August 2009), Literacy and Life Skills for Pasifika Adults: Results from the Adult Literacy and Life Skills (ALL) Survey.
[10] Ministry of Education (July 2008), The Adult Literacy and Life Skills (ALL) Survey: Gender, Ethnicity and Literacy, page 24, www.educationcounts.govt.nz.
[11] Page 14 of the relevant report.
[12] Page 12 of the relevant report.
[13] Page 10 of the relevant report.
[14] Page 8 of the relevant report.
[15] Department of Labour (2008), New Zealand Skills Strategy 2008: Discussion paper, www.skillsstrategy.govt.nz, page 27.
[16] Department of Labour (2008), www.skillsstrategy.govt.nz. Page 27, for example, refers to the 2006 ALL survey results.
[17] Tertiary Education Commission (2008), www.tec.govt.nz. Page 6, for example, refers to the 2006 ALL survey results.
[18] www.literacyandnumeracyforadults.com.

