Indicator 23: Life expectancy
| Indicator is fully reported? |
Yes. |
| Type of indicator |  Outcome indicator Outcome indicator |
| Other relevant indicators | New Zealand uses different age groupings - we report on life expectancy at birth, age 65 (pensionable age), and age 85. |
| Our findings |
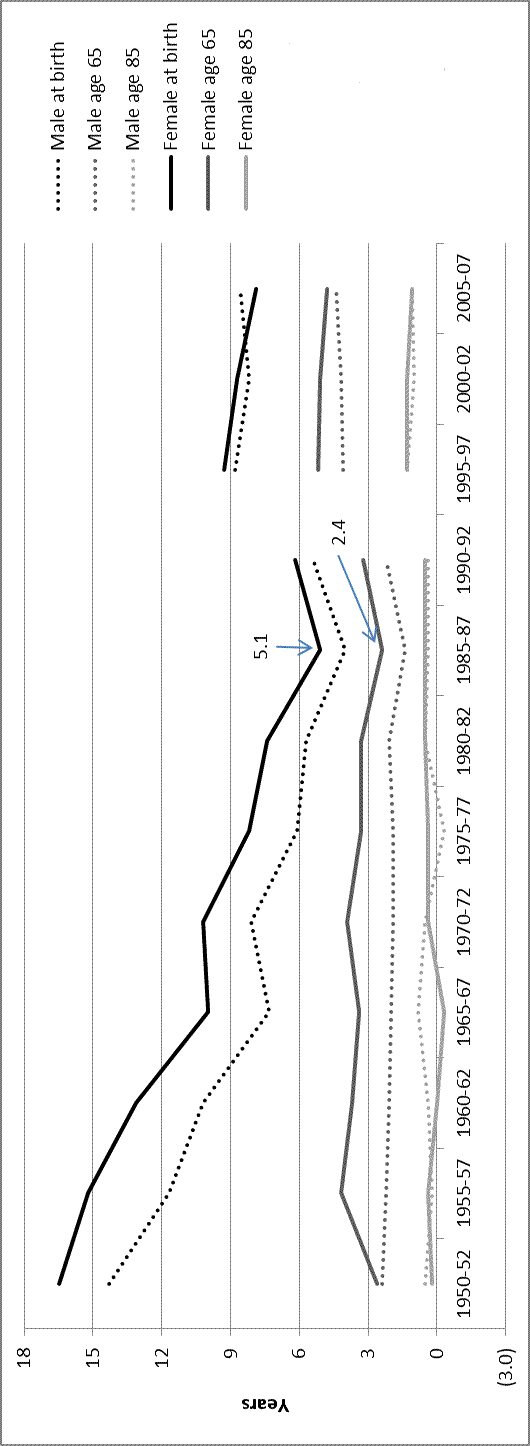
Life expectancy is an indicator of the overall health of a population. It is the estimated average number of years a person has left to live, based on age-specific death rates. Statistics New Zealand produces life expectancy data (called "period life tables") about two years after each census and interim (abridged) period life tables between censuses.[1] Figures 1-9 show life expectancy at birth, age 65, and age 85 (males and females) for the total population and Māori and non-Māori from 1955-57 to 2005-07. Figure 10 shows the difference in life expectancy between Māori and non-Māori males and females at birth, age 65, and age 85 from 1950-52 to 2005-07. There is a break in the data, which shows the difference that changes in the source of ethnicity data and census questions/definitions can have on statistics. Overall, Figures 1-10 show that:
|
| How entities use the data | Statistics New Zealand publishes the data for general use and for use by government departments, such as the Ministry of Health. |
| Entity responsible for this indicator | Statistics New Zealand |
Figure 1: Total population life expectancy at birth
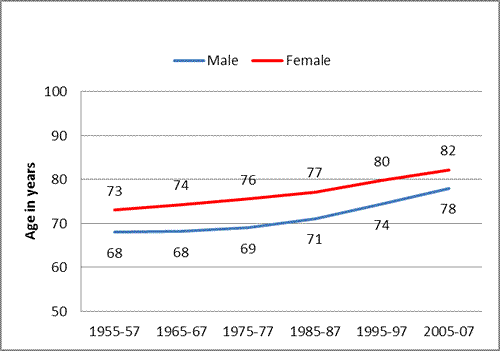
Figure 2: Total population life expectancy at age 65
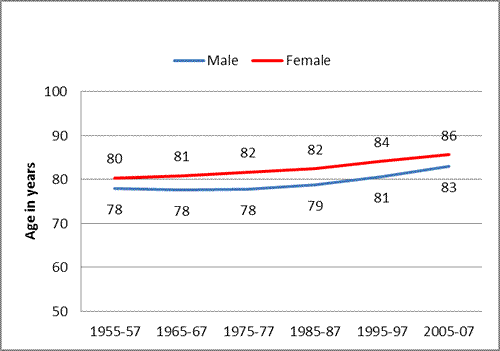
Figure 3: Total population life expectancy at age 85
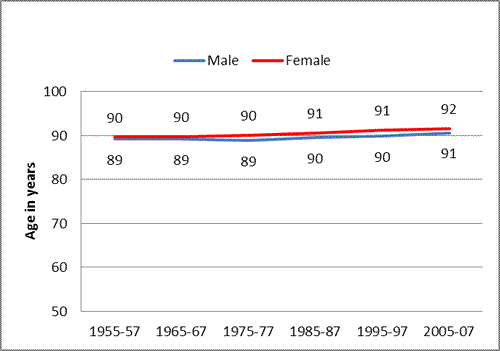
Figure 4: Māori life expectancy at birth
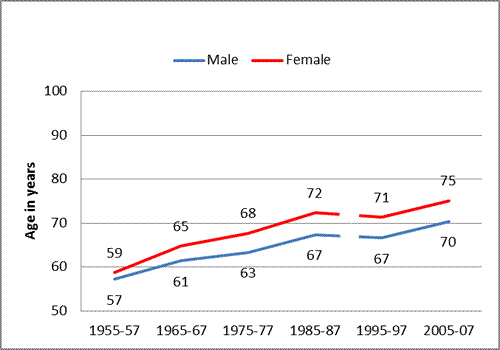
Figure 5: Māori life expectancy at age 65
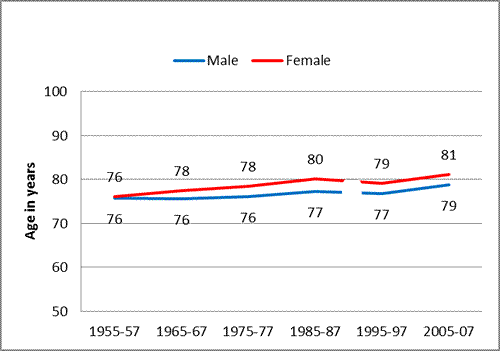
Figure 6: Māori life expectancy at age 85
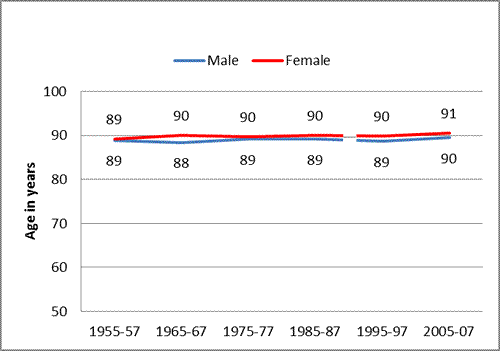
Figure 7: Non-Māori life expectancy at birth
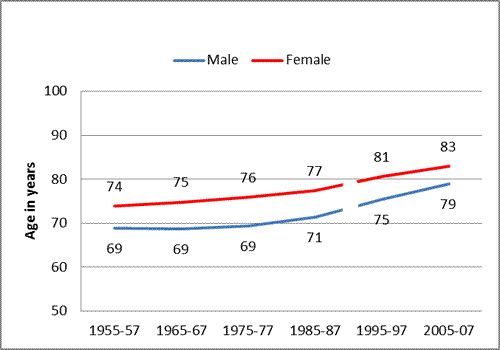
Figure 8: Non-Māori life expectancy at age 65
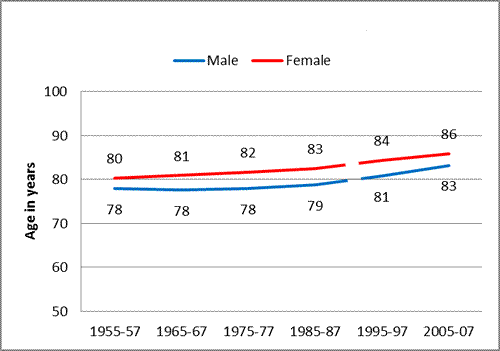
Figure 9: Non-Māori life expectancy at age 85
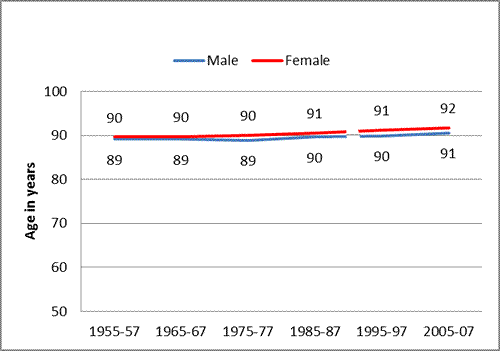
Notes: Data rounded to one decimal place was used to prepare these graphs, but the values are shown rounded to the nearest whole number. The break between 1985-87 and 1995-97 indicates the introduction of new death registration forms in 1995.
Figure 10: Difference in life expectancy between Māori and non-Māori males and females at birth, age 65, and age 85, 1950-52 to 2005-07
[1] www.stats.govt.nz/browse_for_stats/health/life_expectancy.aspx.

