Indicator 2: Older persons living in urban areas
| Indicator is fully reported? | Yes. |
| Type of indicator |  Basic demographic indicator Basic demographic indicator |
| Other relevant indicators | Proportion of older persons living in rural areas by age, sex, and ethnicity |
| Our findings |
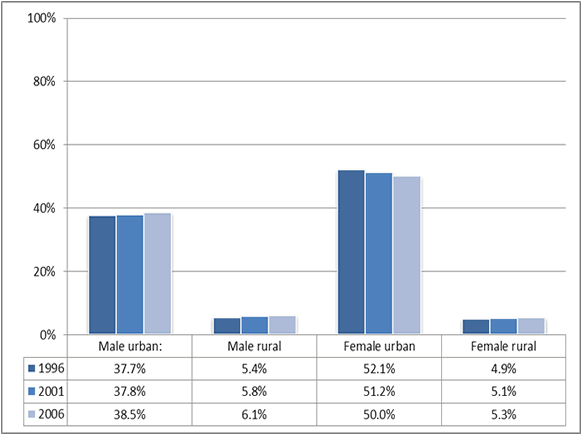
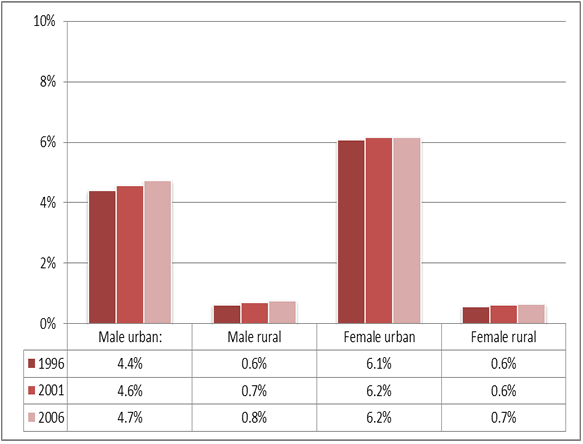
Data on the age, sex, and ethnicity of older people living in urban and rural areas is available from Statistics New Zealand on their website or on request. We used census data published on Statistics NZ’s website from 1996, 2001, and 2006 to report on the proportion of:
The 2006 data showed that:
|
| How entities use the data | Data is used to make projections. |
| Entity responsible for this indicator | Statistics New Zealand |
Figure 1: The proportion of people aged 65+ who lived in urban and rural areas, 1996, 2001, and 2006

Source: Statistics New Zealand (2013), New Zealand: An Urban/Rural Profile Update, www.stats.govt.nz/browse_for_stats/people_and_communities/Geographic-areas/urban-rural-profile-update.aspx. The data used in this report was published in 2008. The document updates and reviews the experimental classification used in the 2004 report New Zealand: An Urban/Rural Profile, using 2006 Census information.
Figure 2: The proportion of the total population who were aged 65+ and lived in urban and rural areas, 1996, 2001, and 2006

Source: Statistics New Zealand (2013), New Zealand: An Urban/Rural Profile Update, www.stats.govt.nz/browse_for_stats/people_and_communities/Geographic-areas/urban-rural-profile-update.aspx. The data used in this report was published in 2008. The document updates and reviews the experimental classification used in the 2004 report New Zealand: An Urban/Rural Profile, using 2006 Census information.
Figure 3: The proportion of people aged 65+ who lived in each region, 1996, 2001, and 2006

Source: Statistics New Zealand. Our data query using Table Builder was for Ethnic Group (Grouped Total Responses) by Age Group, for the Census Usually Resident Population Count, 1996, 2001, and 2006, www.stats.govt.nz.

