Indicator 16: Voting patterns
| Indicator is fully reported? | Yes |
| Type of indicator |  Outcome indicator Outcome indicator |
| Other relevant indicators | Estimated percentage compliance with legal requirement to be on an electoral roll. |
| Our findings | Voter turnout
Every citizen who is 18 years or older can vote in elections of members of the House of Representatives.[1] Voting is not compulsory. Voter turnout describes the proportion of people that voted in an election compared to the population of people who were eligible to vote in that election. Voter turnout rates are a sign of the confidence the population has in political institutions, the importance they attach to them, and the extent to which they feel their vote can make a difference.[2] General election voter turnout has been a Tier 1 statistic in the Official Statistics System since 2005.[3] The New Zealand Electoral Commission (the Commission) collects voter turnout data for general elections three yearly.[4] Voter turnout is a useful indicator of participation in decision-making by all age and ethnic groups. Data about voter turnout in the last general election, by age and ethnicity, was collected in the 2008, 2010, and 2012 New Zealand General Social Surveys (the NZGSS).[5] Data from the 2012 survey is not yet published. Published data The Ministry of Social Development published The Social Report 2010, which gave the percentage voter turnout in four age groups and used 65+ for the oldest age group. It gave partial information about differences in voter turnout by ethnic group. Data was collected between April 2008 and March 2009, which means that responses covered the 2005 and 2008 general elections (the NZGSS 2008). The NZGSS 2008 showed that voter turnout increased with age and was highest in the 65+ age group. Voter turnout rates for ethnic groups were given for the groups with the highest rate (mainly European: 82%) and lowest rate (Asian: 61%). This means that voter turnout for Maori and Pacific was between 61% and 82%. It would have been helpful to publish the data for all ethnic groups. Data on the ethnicity of voters by age group was not reported. Data provided to us Statistics New Zealand provided us with data about voter turnout from the:
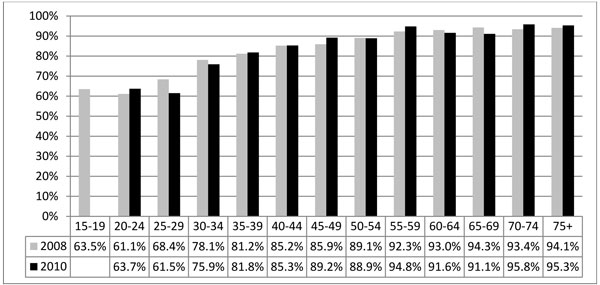
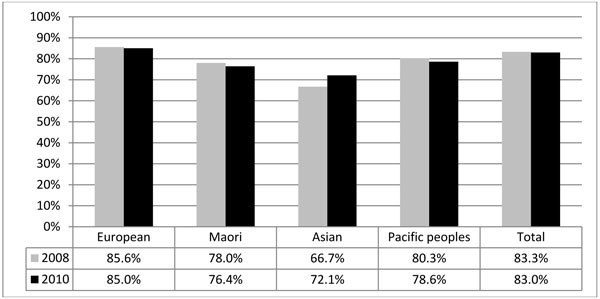
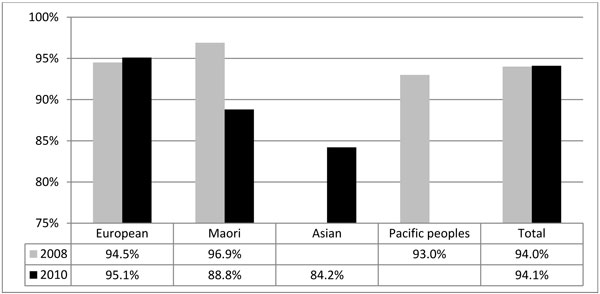
Figures 1-3 show that:
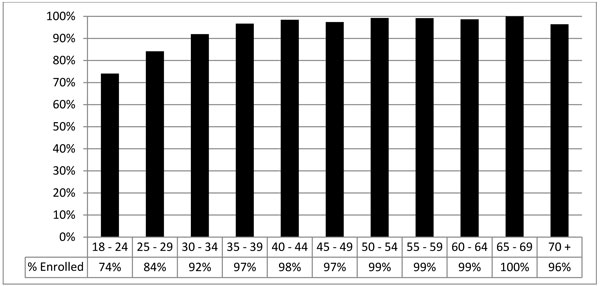
Care has to be taken with use of the data because general elections are held three yearly and the survey is two yearly. The NZGSS 2008 started before the 2008 general election (in November 2008), so early respondents reported on their voting experience for the 2005 general election and later respondents for the 2008 election. The NZGSS 2010 fully correlates with the one election (in 2008), as will the NZGSS 2012 for the 2011 election. The survey in 2014 will again be problematic because those surveyed earlier in the period will respond for the 2011 general election and those surveyed later will respond for the 2014 election. The data needs to be comparable between one survey and the next – particularly if the data is used to evaluate the effectiveness of actions taken to increase voter turnout. We consider that the questions about voter turnout for a general election should only be asked when all the respondents will be answering for the same general election. It is difficult to identify trends when a survey combines data about voter turnout for two general elections. Review of the NZGSS The topics surveyed by the NZGSS are under review. From 2014, basic socio-demographic information and a core set of social indicators will be collected each time the two-yearly survey is completed. The plan is to prepare a set of modules on different topics and collect data on each module at least once every 10 years. Consideration is being given to having a module on civic participation, including voter turnout, and how often this data would be collected during the 10-year cycle. Compliance with compulsory enrolment Registering on an electoral roll is compulsory. The Commission publishes data about the estimated eligible voting population and the number of people enrolled on the general and Māori rolls in five-year age groups.[6] The data is updated monthly. At 14 December 2012 (see Figure 4), compliance by the estimated eligible population with compulsory enrolment was:
Compliance for older people was estimated to be:
The data shows that older voters have relatively high rates of voter turnout and estimated compliance with the requirement to be registered on an electoral roll. This suggests that they have confidence in political institutions. |
| How entities use the data |
The Electoral Commission uses survey data to inform its efforts to increase voter turnout. An independent report[7] describes the steps taken by the Commission to reduce barriers to access to voting for eligible people with disabilities. The Disability Convention states that Governments should ensure that people with disabilities, including older people, can access polling stations, access material about elections and polling stations, and vote in secret or with whatever help is needed from another person. The Electoral Act 1993 (and associated regulations) has provisions that help people to take part in elections, including help with completing enrolment, providing voting facilities in hospitals and similar institutions, and providing electoral staff or allowing a nominated person to help voters. For the last three elections, electoral authorities have prepared a disability action plan. Disability organisations (which did not include age-specific NGOs) helped prepare the plan. Among other things, this has resulted in Easy Read captions on television advertisements and information on accessible polling places. These benefit older people as well as people with disabilities that are not age-related. The Human Rights Commission (et al) considers the Commission has done an excellent job of ensuring that disabled people have the same access to the electoral process as other voters. The Commission conducts a review of each election that includes a general survey of voters and non-voters[8] and a booster survey of voters and non-voters with a disability.[9] Key groups of interest for the 2011 survey were Māori, Youth, Pacific, Asian, and non-voters. The contracted survey company had to achieve a minimum quota of respondents in each of these groups. So far, voter turnout for people aged 46+ has not been a concern to the Commission. The survey company's reports for the Commission do not use the same five-year age groups that government agencies regularly use. For example, 65 year olds are included in the 56-65 age group and the oldest age group is those aged 66+. Their reports define older people as those aged 46+ years. |
| Entity responsible for this indicator |
Statistics NZ – for collecting data about voter turnout by age and ethnicity in the NZ General Social Survey, if it is included in future surveys. Electoral Commission – for encouraging voter enrolment, reducing barriers to voting, and commissioning surveys of voters and non-voters after elections to identify understand what the barriers to voting are and how to address these for each identified population group. |
Figure 1: Percentage of New Zealanders who voted in the last general election, by five-year age group, 2008 and 2010

Source: Statistics New Zealand. Data is not provided where there was a high relative sampling error. The classification groups "Middle Eastern/Latin American/African" and "Other" were too small for analysis. The NZGSS 2008 reports on voter turnout from the 2005 and 2008 general elections.
Note: Sampling errors with the current sample sizes are inevitable when measures are broken down by two or more variables, such as age, gender, and ethnicity.
Figure 2: Percentage of New Zealanders who voted in the last general election, by ethnicity, NZGSS 2008 and 2010

Source: Statistics NZ. The classification groups "Middle Eastern/Latin American/African" and "Other" were too small for analysis. The NZGSS 2008 reports on voter turnout from the 2005 and 2008 general elections.
Figure 3: Percentage of New Zealanders aged 65 years and older who voted in the last general election, by ethnicity, NZGSS 2008 and 2010

Source: Statistics NZ. The classification groups "Middle Eastern/Latin American/African" and "Other" were too small for analysis. The NZGSS 2008 reports on voter turnout from the 2005 and 2008 general elections.
Figure 4: Estimated percentage of eligible voters registered on an electoral roll, by five-year age group, November 2012

Source: www.elections.org.nz, downloaded 14 December 2012. Figures are rounded.
[1] New Zealand Bill of Rights Act 1990, section 12.
[2] Ministry of Social Development (2010), The Social Report 2010, page 74.
[3] Statistics New Zealand (16 October 2010), Tier 1 statistics 2012, page 1.
[4] Voter turnout for local elections is not covered by this indicator.
[5] www.stats.govt.nz/browse_for_stats/people_and_communities/Families/nz-general-social-survey-info-releases.aspx.
[7] Human Rights Commission, Ombudsman, and The New Zealand Convention Coalition (2012), Making disability rights real: Annual report of the Independent Monitoring Mechanism of the Convention on the Rights of Persons with Disabilities, 1 July 2011 – 30 June 2012, pages 83-86.
[8] For example, Colmar Brunton (2012), Voter and non-voter survey report.
[9] For example, Colmar Brunton (2012), Disability voter and non-voter survey report.

