Indicator 14: Family and community support
| Indicator is fully reported? |
Data is publicly available about the proportion of older people providing support to younger people.[1] Statistics New Zealand can provide more detailed data on request. Information is not easily available about the proportion of older people receiving support. |
| Type of indicator |  Outcome indicator Outcome indicator |
| Other relevant indicators |
|
| Our findings |
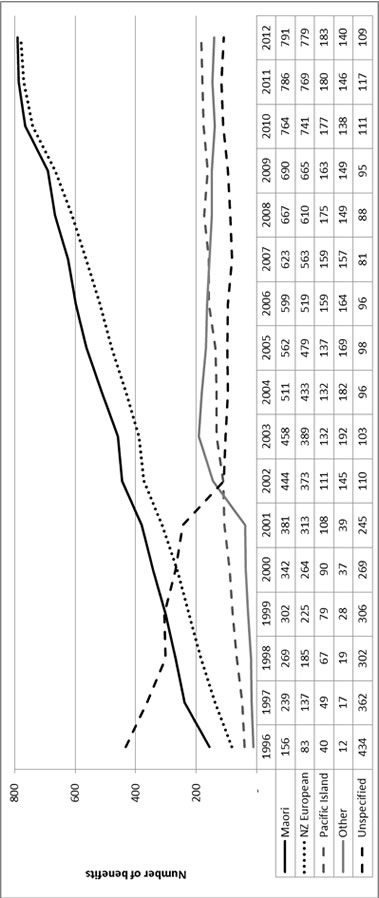
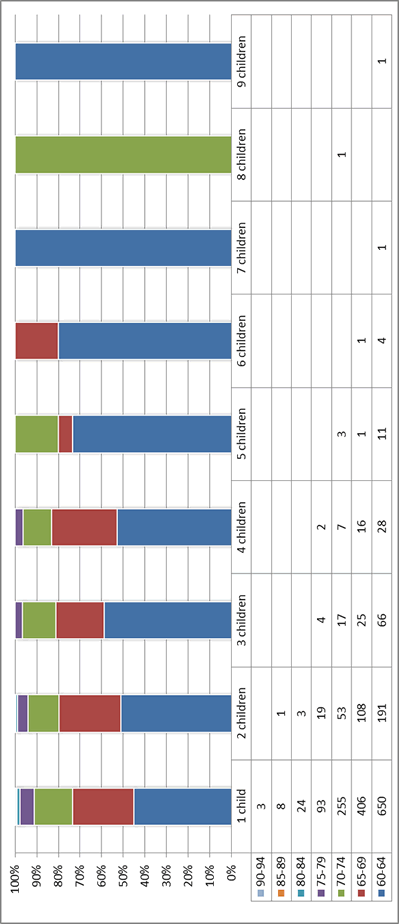
Healthy, active, older people can positively contribute to society. To report on this indicator, we selected some data from a wide range of information that is available from Statistics New Zealand. The Ministry of Social Development also gave us some data. Data about the support that older people provide to others is collected as part of surveys that find out how people of all ages spend their time – the Time Use Survey. Information about the participants is collected, such as their age, sex, ethnicity, and labour force status. The New Zealand General Social Survey also collects relevant data. Figure 1 shows that in 2008 and 2010, 54% of all people surveyed aged 60+ provided some form of support to people aged 0-64. For the ethnic groups where the data is more reliable, older Maori provide relatively more support than other ethnic groups. On the flip side, an average 29% of younger people provided support to people aged 65+ (see Figure 2). Figure 3 shows the proportion of men aged 60+ who supported younger family members aged 0-64 in 2008 and 2010. Figure 4 shows the same data for women. The general trend is that the quantity of support that people provide decreases as they get older. Figures 5, 6, and 7 show participation rates in unpaid work (in and out of the home) during a four-week period. Data is shown for the total 65+ population, men and women. Some people surveyed were also in paid work. The figures show that fewer people aged 75+ were engaged in unpaid work compared with people aged 65+. From 1999 to 2010, older people did more unpaid work for other households and organisations, and did less unpaid work in their own home. Older people raising children who are not their own Eligible older people can receive financial help from the government to help them care for someone else’s child or children. The benefits are the Orphan's Benefit and Unsupported Child's Benefit, which may be paid for children up to the age of 18.[3] Data is available by age, ethnicity, and gender. Figure 8 shows that the number of children raised by an older person who is not their parent steadily increased between 1996 and 2012. Significantly more women than men received benefits. Figure 9 shows that caregivers were mostly Maori and NZ European, and ethnicity was specified for more people over time. Figure 10 shows that for 2012:
|
| How entities use the data |
Statistics NZ makes the data available for use by others. Benefit statistics are published in relevant reports explaining where government funding was used. |
| Entity responsible for this indicator |
Statistics New Zealand – for the surveys. Ministry of Social Development – for benefit data. |
Figure 1: Percentage of people aged 60+ who supported younger people by ethnicity of respondent, 2008 and 2010
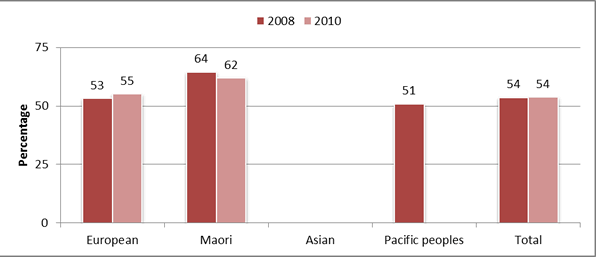
Source: New Zealand General Social Surveys 2008 and 2010, Statistics New Zealand. Data is not shown where there was a relative sampling error of 30% or more. The total percentage includes data for all ethnic groups. Figures are rounded to the nearest percent.
Figure 2: Percentage of people aged 15-59 years who supported people aged 65+ by ethnicity of respondent, 2008 and 2010
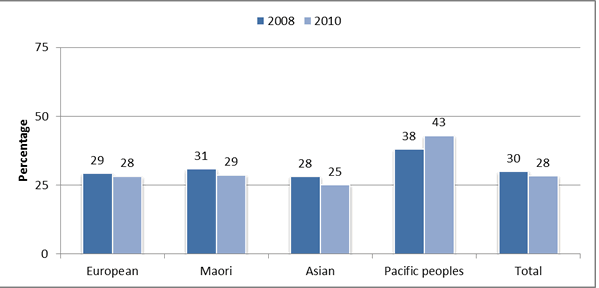
Source: New Zealand General Social Surveys 2008 and 2010, Statistics New Zealand. The total percentage includes data for all ethnic groups. Figures are rounded to the nearest percent. People could identify with more than one ethnic group.
Figure 3: Percentage of men aged 60+ who supported a younger family member by respondent age group and age of recipient, 2008 and 2010
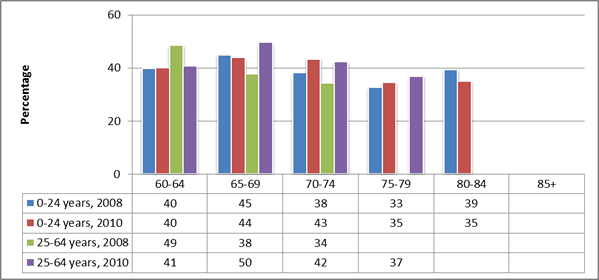
Source: New Zealand General Social Surveys 2008 and 2010, Statistics New Zealand. Data is not shown where there was a relative sampling error of 30% or more. Figures are rounded to the nearest percent.
Figure 4: Percentage of women aged 60+ who supported a younger family member by respondent age group and age of recipient, 2008 and 2010
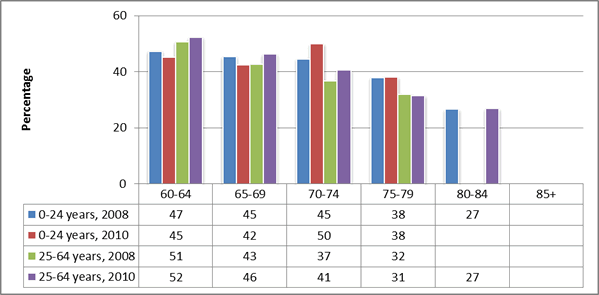
Source: New Zealand General Social Surveys 2008 and 2010, Statistics New Zealand. Data is not shown where there was a relative sampling error of 30% or more. Figures are rounded to the nearest percent.
Figure 5: Total participation by people aged 65+ and 75+ in unpaid work during a four-week period, 1999 and 2010
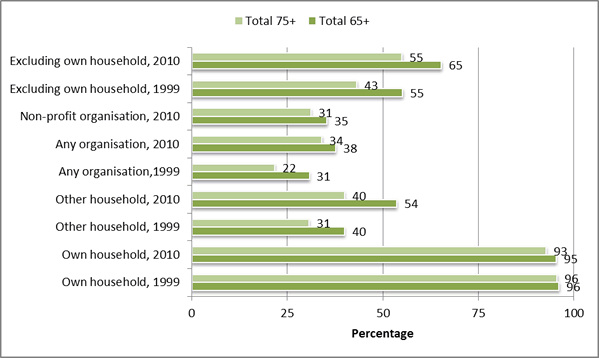
Source: Time Use Surveys data from 1998/99 and 2009/10, Statistics New Zealand. Multiple “who for” responses were allowed, which means the percentages for unpaid work for another household and unpaid work for any organisation (or non-profit organisation) may not equal the percentage for unpaid work excluding own household.
Figure 6: Participation by men aged 65+ and 75+ in unpaid work during a four-week period, 1999 and 2010
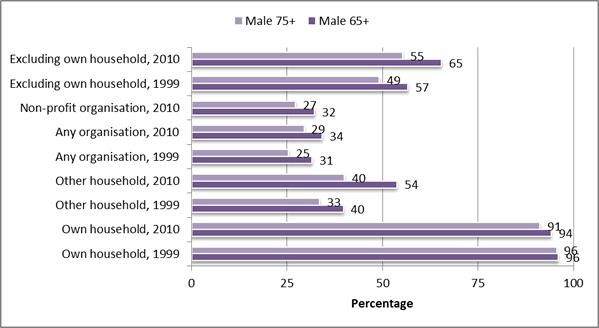
Source: Time Use Surveys data from 1998/99 and 2009/10, Statistics New Zealand. Multiple “who for” responses were allowed, which means the percentages for unpaid work for another household and unpaid work for any organisation (or non-profit organisation) may not equal the percentage for unpaid work excluding own household.
Figure 7: Participation by women aged 65+ and 75+ in unpaid work during a four-week period, 1999 and 2010
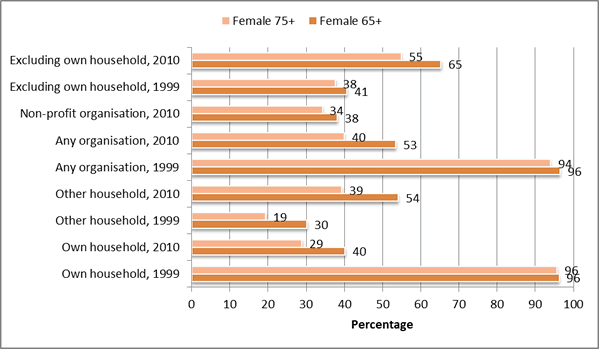
Source: Time Use Surveys data from 1998/99 and 2009/10, Statistics New Zealand. Multiple “who for” responses were allowed, which means the percentages for unpaid work for another household and unpaid work for any organisation (or non-profit organisation) may not equal the percentage for unpaid work excluding own household.
Figure 8: Number of orphan’s and unsupported child’s benefits received by males and females aged 65+, 1996-2012
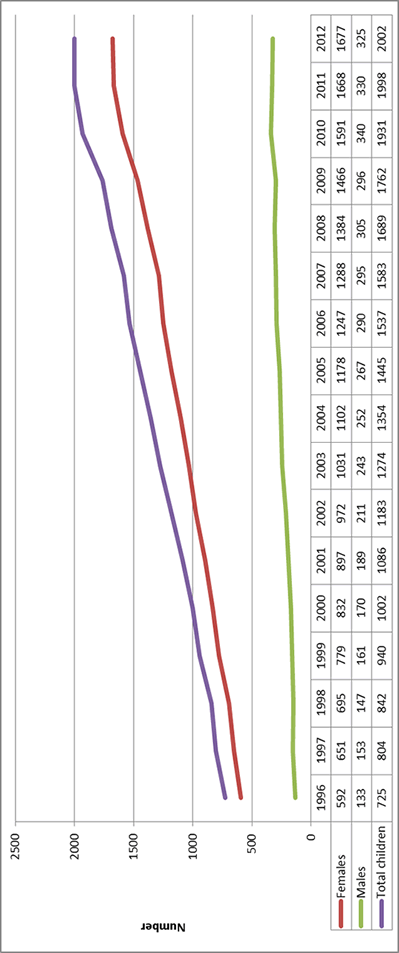
Source: Ministry of Social Development, 2013. An older person may have cared for more than one child and received a benefit for each child.
Figure 9: Number of orphan’s and unsupported child’s benefits received by people aged 60+ by ethnicity, 1996-2012
Source: Ministry of Social Development, 2013.
Figure 10: Number of children cared for by people aged 60+ in five-year age groups, 2012
Source: Ministry of Social Development, 2013.
[1] Information is collected on a range of topics such as whether someone provides or pays for groceries or needed clothing; give money to pay bills, debt, rent, spending money, big cost items such as a car or furniture, and educational costs; has someone to stay in their house for some of the time; provides childcare or child minding; cares for ill or disabled relatives; regularly helps with housework or gardening; and regularly provides transport.
[2] The New Zealand Positive Ageing Strategy (2001) is available at www.msd.govt.nz/what-we-can-do/seniorcitizens/positive-ageing/index.html.
[3] Information about the benefits is available from www.workandincome.govt.nz/individuals/a-z-benefits/unsupported-childs-benefit.html and www.workandincome.govt.nz/individuals/a-z-benefits/orphans-benefit.html.
[4] In 1997 and 1998 one person aged 100+ received a benefit. After that, no one over the age of 89 received a benefit until 2011.

