Indicator 5: Living arrangements
| Indicator is fully reported? |
Partly, for the data we selected. |
| Type of indicator |  Basic demographic indicator Basic demographic indicator |
| Our findings |
There are different types of living arrangements, such as whether someone lives:
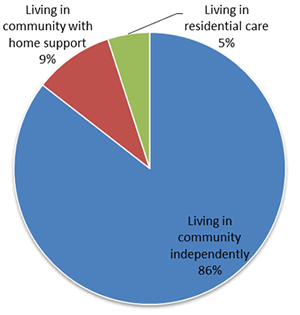
An older person mignt be living in a one-person household or with a range of other people, such as children, a partner, siblings, or unrelated others. At each census, data is collected on these variables as well as on the different types of accommodation that people live in, such as hotels, motels, hospitals, retirement homes, prisons, hostels, boarding houses, defence barracks, flats, units, townhouses, apartments, houses, or motor camps. The 2006 census information is reported at www.stats.govt.nz/browse_for_stats/people_and_communities/older_people/new-zealands-65-plus-population.aspx. You can read summary data for men and women aged 65+ on page 24 of Demographic Aspects of New Zealand’s Ageing Population (March 2006).[1] Census data can be combined with information from other sources, as needed. For example, Statistics New Zealand used information about publicly funded home-based support services for 2008/09 and census data to show the estimated proportion of older people who live at home with support, and to estimate the proportion of older people living in residential care. Figure 1 shows that 5% of people aged 65+ lived in residential care and the rest lived in the community, with or without publicly funded home support. Figure 2 shows the ethnic distribution of the population by living arrangement. |
| How entities use the data | The data is published for general use. |
| Entity responsible for this indicator | Statistics New Zealand |
Figure 1: Estimated proportion of people aged 65+ by living arrangement, 2008/09

Source: Statistics New Zealand (4 June 2010), www.stats.govt.nz. Statistics NZ calculated the proportions using population statistics as at 30 June 2006 and 2008/09 data from the Ministry of Health as at 4 June 2010. Data about people receiving privately funded home-based support services was not included.
Figure 2: Estimated proportion of people aged 65+ by living arrangement and ethnicity, 2008/09
| Type of living arrangement | European/Other | Māori | Pacific | Total |
|---|---|---|---|---|
| Living in community independently | 78.90% | 4.60% | 2.10% | 85.60% |
| Living in community with home support | 9.10% | 0.30% | 0.10% | 9.50% |
| Living in residential care | 4.80% | 0.20% | 0.10% | 5.00% |
| Total | 92.70% | 5.00% | 2.30% | 100% |
Note: Rounding affects the totals, and people may have specified more than one ethnicity.
[1] www.stats.govt.nz/browse_for_stats/people_and_communities/older_people/demographic-aspects-nz-ageing-population.aspx.

