Indicator 28: Quality of life and health
| The indicator is fully reported? | Yes. |
| Type of indicator |  Outcome indicator Outcome indicator |
| Our findings |
Satisfaction with quality of life and health can be assessed in different ways. For example:
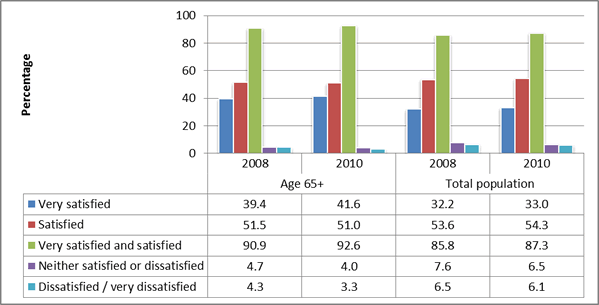
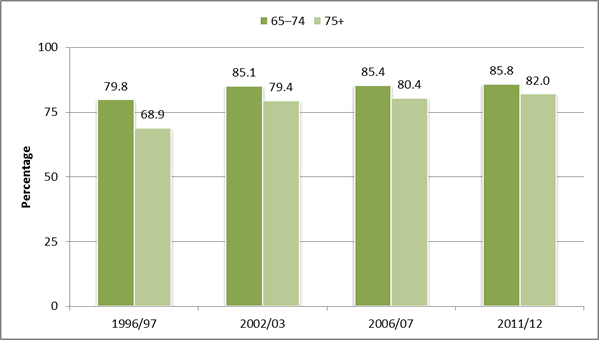
We discussed non-monetary indicators in our report on Madrid indicator 7. We discuss the other topics here. Overall life satisfaction Results are available from the 2008 and 2010 New Zealand General Social Surveys. For both surveys, Figure 1 shows that more than 90% of people aged 65+ were satisfied or very satisfied with their life, which was about 5% higher than the total population. Self-assessed health status Respondents to the New Zealand Health Survey are asked to rate their health status on a five-point scale, from excellent to poor. The Ministry publishes plain-English reports on each survey’s key findings, and the supporting data tables are also published.[4] Comments are sometimes made about the similarities and differences with previous surveys. Figure 2 shows that the health status of people aged 65+ has generally been consistent, in statistical terms, since 1996/97. The Ministry’s report on the results of the 2011/12 survey stated that:
Social isolation and loneliness Social isolation and loneliness differ. Social isolation objectively describes the absence of social contact. Loneliness measures how satisfied people are with the quantity and quality of contact they have with other people. Research has shown that social isolation and loneliness are associated with a range of health issues, including increased mortality. Data from the 2010 New Zealand General Social Survey show that adults who felt lonely all the time in the last four weeks (59%) were less likely to be satisfied with their life overall than those who never felt lonely (91%).[8] The study found that, as people get older, the likelihood of them feeling lonely decreased.[9] People aged 65+ reported the lowest levels of loneliness (11%) compared to:
However, older people living in economic hardship were more likely than younger age groups living in similar levels of hardship to feel lonely. An increase in economic standard of living also resulted in a larger decrease in the likelihood of feeling lonely for older people than it did for younger age groups.[11] |
| How entities use the data |
The New Zealand General Social Survey provides a view of how well-being outcomes are distributed across different groups within the population. Health survey data helps to monitor the state of the public’s health and the effectiveness of the health and disability system. The loneliness report can be used to design appropriate interventions to reduce loneliness for each age group. The report identifies potential areas for further research.[12] Social isolation and loneliness are identified as targets for reduction by the Ministry of Health and district health boards in the Health of Older People Strategy.[13] |
| Entity responsible for this indicator |
Ministry of Health – New Zealand Health Survey. Ministry of Social Development – assessment of living standards. Statistics New Zealand – New Zealand General Social Survey. |
Figure 1: Overall life satisfaction for people aged 65+ and the total population, 2008 and 2010 New Zealand General Social Surveys

The data in this graph came from the 2008 data tables (see table 3.01) and 2010 data tables (see table 2) of the New Zealand General Social Survey, which is available at www.stats.govt.nz/browse_for_stats/people_and_communities/Families/nz-general-social-survey-info-releases.aspx.
Figure 2: Excellent, very good, or good self-rated health for older age groups, 1996/97 to 2011/12

Source: Ministry of Health (2013), Data tables: Health status, health behaviours, and risk factors, www.health.govt.nz/publication/health-new-zealand-adults-2011-12. The Ministry of Health reported that there was a statistically significant difference (at the 95% confidence level) for the 65-74 age group between 1996/97 and 2011/12. There was a statistically significant difference (at the 95% confidence level) for the 75+ age group over the same period. The other changes were not statistically significant.
[1] Ministry of Social Development (2012), Household incomes in New Zealand: Trends in indicators of inequality and hardship,1982 to 2011, page 62, www.msd.govt.nz/about-msd-and-our-work/publications-resources/monitoring/household-incomes/.
[2] Information about the survey and the results of the surveys are available from www.stats.govt.nz/browse_for_stats/people_and_communities/Families/nz-general-social-survey-info-releases.aspx.
[3] www.health.govt.nz/publication/health-new-zealand-adults-2011-12, see Section 1: Health Status.
[4] www.health.govt.nz/publication/health-new-zealand-adults-2011-12.
[5] See Figure 3, page 16, www.health.govt.nz/publication/health-new-zealand-adults-2011-12.
[6] See Table 4, page 17, www.health.govt.nz/publication/health-new-zealand-adults-2011-12.
[7] See Figure 4, page 17, www.health.govt.nz/publication/health-new-zealand-adults-2011-12.
[8] Statistics New Zealand (2013), Loneliness in New Zealand: Findings from the 2010 NZ General Social Survey, page 6, www.stats.govt.nz/browse_for_stats/people_and_communities/older_people/loneliness-in-nz-2010-NZGSS.aspx.
[9] Statistics New Zealand (2013), Loneliness in New Zealand: Findings from the 2010 NZ General Social Survey, page 9, Figure 3.
[10] Statistics New Zealand (2013), Loneliness in New Zealand: Findings from the 2010 NZ General Social Survey, page 8.
[11] Statistics New Zealand (2013), Loneliness in New Zealand: Findings from the 2010 NZ General Social Survey, page 11.
[12] Statistics New Zealand (2013), Loneliness in New Zealand: Findings from the 2010 NZ General Social Survey, page 12.
[13] Statistics New Zealand (2013), Loneliness in New Zealand: Findings from the 2010 NZ General Social Survey, page 6. See also page 39 of the strategy at www.health.govt.nz/publication/health-older-people-strategy.

