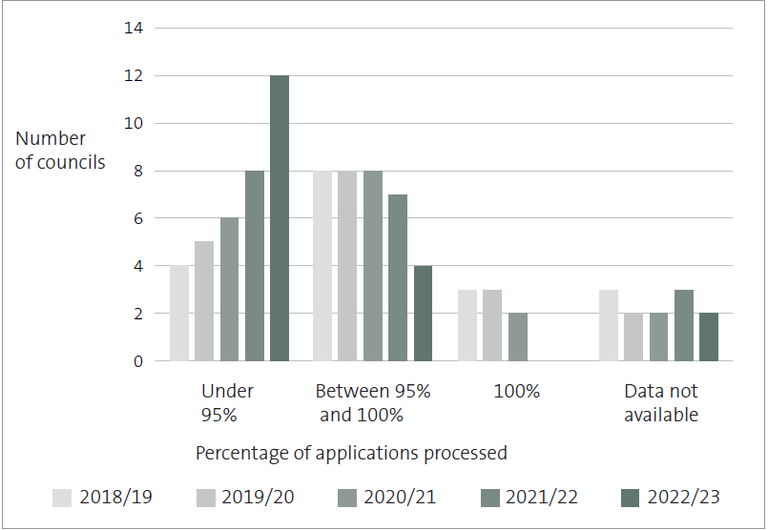
Figure 9 Tier 1 councils’ compliance with statutory time frames for processing resource consent applications, 2018/19 to 2022/23
Bar graph showing how many Tier 1 councils met the statutory time frame for processing resource consent applications from 2018/19 to 2022/23. The number of councils that processed 100% of resource consent applications within the statutory time frame decreased from three to two during this period. The number of councils that processed between 95% and 100% of resource consent applications within the statutory time frame decreased from eight to four during this period. The number of councils that processed fewer than 95% of resource consent applications within the statutory time frame increased from four to 12 during this period.
https://oag.parliament.nz/2024/local-govt/gfx/figure-9.png/view
https://oag.parliament.nz/2024/local-govt/gfx/figure-9.png/@@download/image/figure-9.png
Figure 9 Tier 1 councils’ compliance with statutory time frames for processing resource consent applications, 2018/19 to 2022/23
Bar graph showing how many Tier 1 councils met the statutory time frame for processing resource consent applications from 2018/19 to 2022/23. The number of councils that processed 100% of resource consent applications within the statutory time frame decreased from three to two during this period. The number of councils that processed between 95% and 100% of resource consent applications within the statutory time frame decreased from eight to four during this period. The number of councils that processed fewer than 95% of resource consent applications within the statutory time frame increased from four to 12 during this period.


