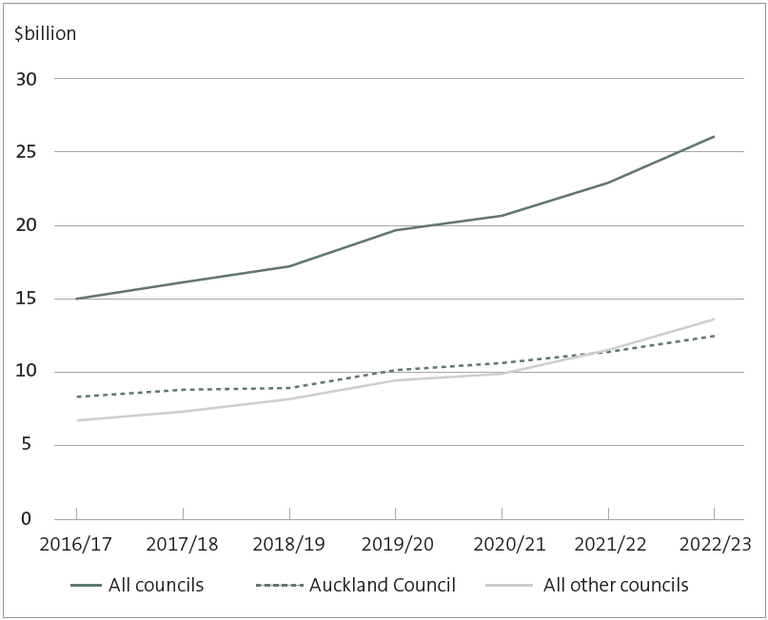
Figure 21 Council debt, 2016/17 to 2022/23
Line graph shows that debt for all councils increased from about $15 billion in 2016/17 to about $26 billion in 2022/23. Auckland council’s debt increased from about $8.3 billion in 2016/17 to about $13.5 billion in 2022/23. Debt for all councils except for Auckland council increased from about $6.7 billion in 2016/17 to about $12.4 billion in 2022/23.
https://oag.parliament.nz/2024/local-govt/gfx/figure-21.png/view
https://oag.parliament.nz/2024/local-govt/gfx/figure-21.png/@@download/image/figure-21.png
Figure 21 Council debt, 2016/17 to 2022/23
Line graph shows that debt for all councils increased from about $15 billion in 2016/17 to about $26 billion in 2022/23. Auckland council’s debt increased from about $8.3 billion in 2016/17 to about $13.5 billion in 2022/23. Debt for all councils except for Auckland council increased from about $6.7 billion in 2016/17 to about $12.4 billion in 2022/23.


