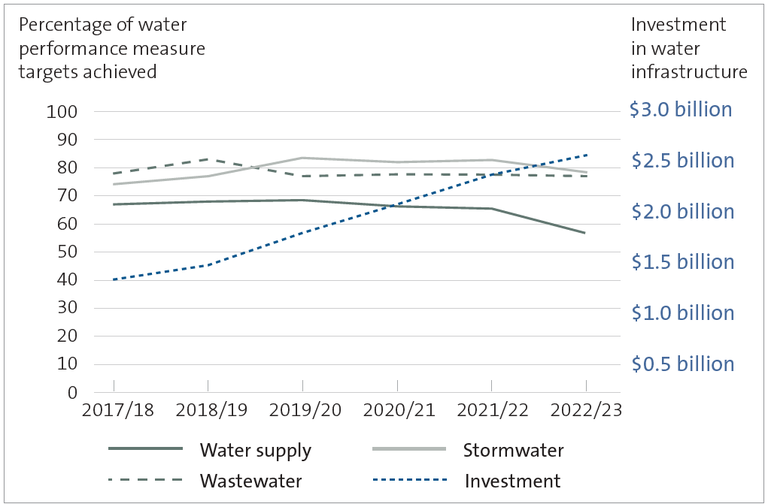
Figure 11 Percentage of water supply, wastewater, and stormwater performance measure targets achieved, compared to the level of investment in three waters assets, 2017/18 to 2022/23
Line graph compares the percentage of water measure targets achieved by councils with how much investment is going into all water infrastructure, from 2017/18 to 2022/23. The graph shows that, despite investment increasing during this period, there has not been an improvement in councils’ performance in achieving water performance measure targets.
https://oag.parliament.nz/2024/local-govt/gfx/figure-11.png/view
https://oag.parliament.nz/2024/local-govt/gfx/figure-11.png/@@download/image/figure-11.png
Figure 11 Percentage of water supply, wastewater, and stormwater performance measure targets achieved, compared to the level of investment in three waters assets, 2017/18 to 2022/23
Line graph compares the percentage of water measure targets achieved by councils with how much investment is going into all water infrastructure, from 2017/18 to 2022/23. The graph shows that, despite investment increasing during this period, there has not been an improvement in councils’ performance in achieving water performance measure targets.


