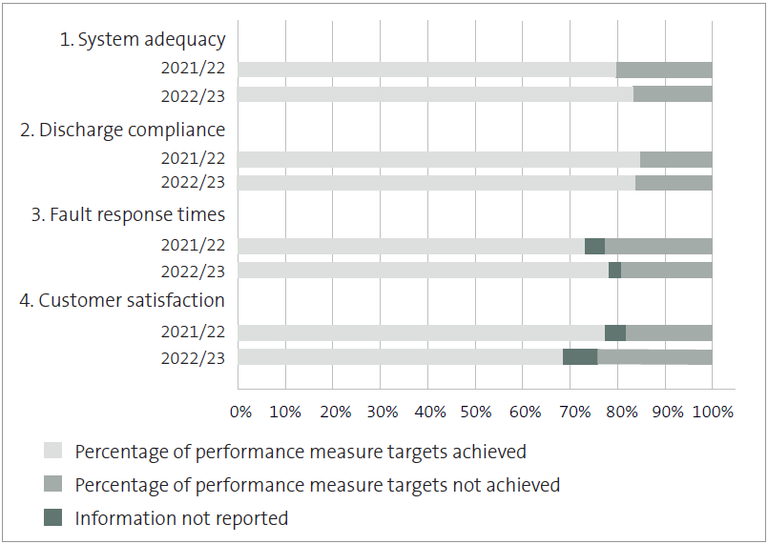
Figure 13 Percentage of wastewater performance measure targets achieved in 2021/22 and 2022/23 for all councils
Bar graph showing percentage of performance measure targets achieved by all councils for wastewater. For system adequacy, councils achieved 48.26% of targets in 2021/22 and 32.99% of targets in 2022/23. For discharge compliance, councils achieved 52.94% of targets in 2021/22 and 50% of targets in 2022/23. For fault response times, councils achieved 79.57% of targets in 2021/22 and 76.95% of targets in 2022/23. For customer satisfaction, councils achieved 67.16% of targets in 2021/22 and 61.49% of targets in 2022/23.
https://oag.parliament.nz/2024/local-govt/gfx/figure-13.png/view
https://oag.parliament.nz/2024/local-govt/gfx/figure-13.png/@@download/image/figure-13.png
Figure 13 Percentage of wastewater performance measure targets achieved in 2021/22 and 2022/23 for all councils
Bar graph showing percentage of performance measure targets achieved by all councils for wastewater. For system adequacy, councils achieved 48.26% of targets in 2021/22 and 32.99% of targets in 2022/23. For discharge compliance, councils achieved 52.94% of targets in 2021/22 and 50% of targets in 2022/23. For fault response times, councils achieved 79.57% of targets in 2021/22 and 76.95% of targets in 2022/23. For customer satisfaction, councils achieved 67.16% of targets in 2021/22 and 61.49% of targets in 2022/23.


