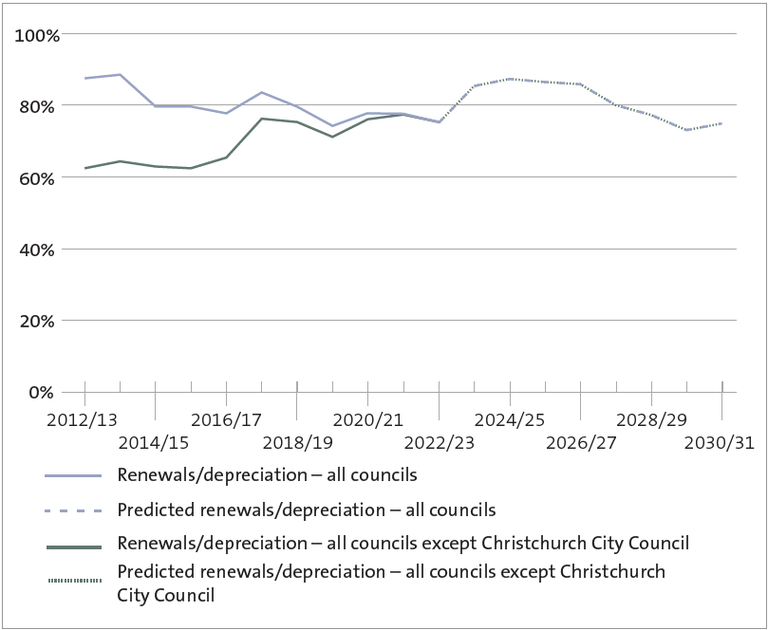
Figure 15 Renewal capital expenditure compared with depreciation for all councils, actual percentages for 2012/13 to 2022/23 and predicted percentages for 2023/24 to 2030/31
There are two lines on the graph. One line includes all councils, and the other includes all councils except for Christchurch City Council. From 2013 to 2018, the line that includes all councils has significantly higher renewal capital expenditure than the line that excludes Christchurch City Council. However, from 2021/22, the two lines have the same level of investment. Both lines show that renewal capital expenditure was less than depreciation for the period covered by the graph. Councils’ actual performance ranged between 74% and 76% from 2019/20 to 2022/23. There is an expected step change from 2023/24, where councils’ renewal investment is predicted to range between 86% and 88% for the next four financial years. However, this is then predicted to steadily decline to 73% by 2029/30.
https://oag.parliament.nz/2024/local-govt/gfx/figure-15.png/view
https://oag.parliament.nz/2024/local-govt/gfx/figure-15.png/@@download/image/figure-15.png
Figure 15 Renewal capital expenditure compared with depreciation for all councils, actual percentages for 2012/13 to 2022/23 and predicted percentages for 2023/24 to 2030/31
There are two lines on the graph. One line includes all councils, and the other includes all councils except for Christchurch City Council. From 2013 to 2018, the line that includes all councils has significantly higher renewal capital expenditure than the line that excludes Christchurch City Council. However, from 2021/22, the two lines have the same level of investment. Both lines show that renewal capital expenditure was less than depreciation for the period covered by the graph. Councils’ actual performance ranged between 74% and 76% from 2019/20 to 2022/23. There is an expected step change from 2023/24, where councils’ renewal investment is predicted to range between 86% and 88% for the next four financial years. However, this is then predicted to steadily decline to 73% by 2029/30.


