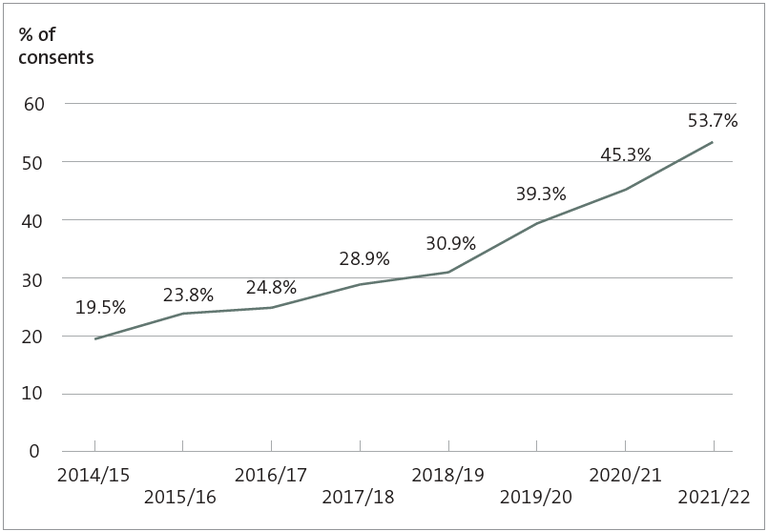
Figure 10 Percentage of resource consent applications that used at least one section 37 (extended time frames) in their processing, 2014/15 to 2021/22
Line graph showing the increasing use of section 37 of the Resource Management Act to extend the time frame for processing resource consent applications. This increased from 19.5% in 2014/15 to 53.7% in 2021/22.
https://oag.parliament.nz/2024/local-govt/gfx/figure-10.png/view
https://oag.parliament.nz/2024/local-govt/gfx/figure-10.png/@@download/image/figure-10.png
Figure 10 Percentage of resource consent applications that used at least one section 37 (extended time frames) in their processing, 2014/15 to 2021/22
Line graph showing the increasing use of section 37 of the Resource Management Act to extend the time frame for processing resource consent applications. This increased from 19.5% in 2014/15 to 53.7% in 2021/22.


