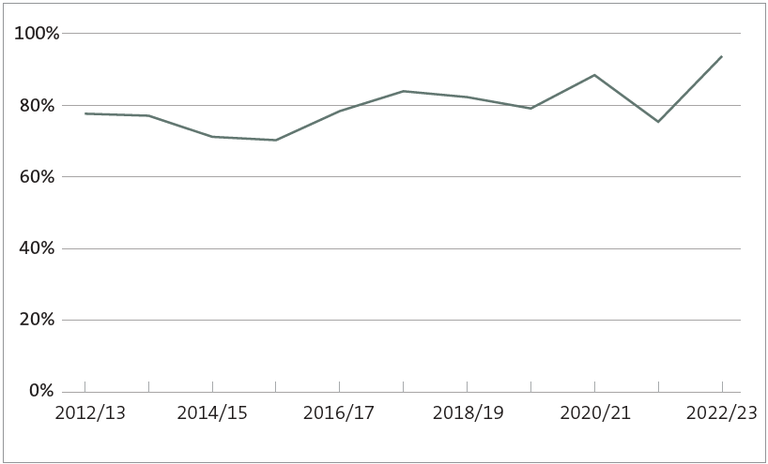
Figure 19 Average percentage of capital expenditure budget spent for all councils, 2012/13 to 2022/23
This figure shows that, from 2015/16 to 2022/23, councils have spent, on average, between 70% and 94% of their capital expenditure budgets. Between 2012/13 and 2016/17, average spending remained below 78% every year. From 2017/18, average spending has been higher than 80%, other than in 2019/20 when it was 79% and 2021/22 when it was 76%.
https://oag.parliament.nz/2024/local-govt/gfx/figure-19.png/view
https://oag.parliament.nz/2024/local-govt/gfx/figure-19.png/@@download/image/figure-19.png
Figure 19 Average percentage of capital expenditure budget spent for all councils, 2012/13 to 2022/23
This figure shows that, from 2015/16 to 2022/23, councils have spent, on average, between 70% and 94% of their capital expenditure budgets. Between 2012/13 and 2016/17, average spending remained below 78% every year. From 2017/18, average spending has been higher than 80%, other than in 2019/20 when it was 79% and 2021/22 when it was 76%.


