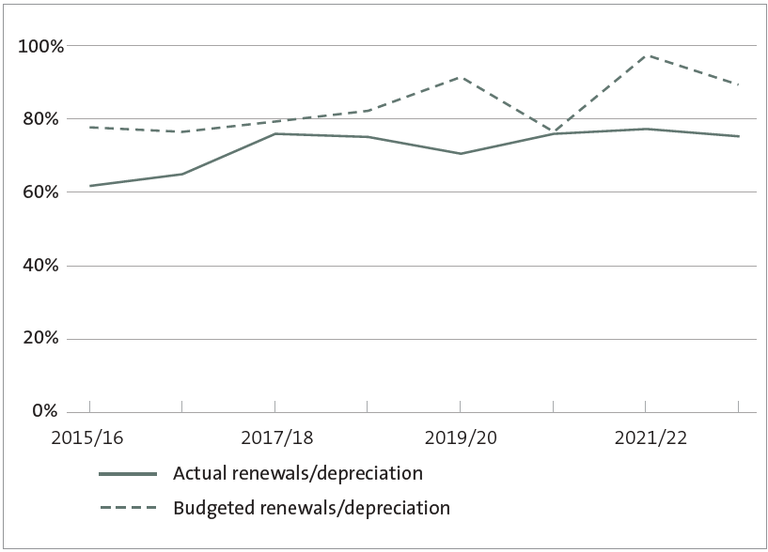
Figure 17 Actual and budgeted renewal capital expenditure compared with depreciation for all councils excluding Christchurch City Council, 2015/16 to 2022/23
This figure shows two lines. One line shows budgeted capital expenditure compared with depreciation. The other line shows the actual capital expenditure compared with depreciation. In every year, the budgeted line is higher than the actual line. The actual and budgeted lines are closest in 2017/18 and 2020/21. The margin between the budget and actual result is widest in 2019/20 and 2021/22.
https://oag.parliament.nz/2024/local-govt/gfx/figure-17.png/view
https://oag.parliament.nz/2024/local-govt/gfx/figure-17.png/@@download/image/figure-17.png
Figure 17 Actual and budgeted renewal capital expenditure compared with depreciation for all councils excluding Christchurch City Council, 2015/16 to 2022/23
This figure shows two lines. One line shows budgeted capital expenditure compared with depreciation. The other line shows the actual capital expenditure compared with depreciation. In every year, the budgeted line is higher than the actual line. The actual and budgeted lines are closest in 2017/18 and 2020/21. The margin between the budget and actual result is widest in 2019/20 and 2021/22.


