Part 4: Councils’ investment in infrastructure
4.1
In this Part, we consider:
- how councils reinvested in their assets;
- how councils delivered on their capital expenditure budgets; and
- debt owed by councils and indicators of financial sustainability.40
Summary of findings
4.2
Since 2012/13, we have been reporting that councils are not adequately reinvesting in their assets. In both 2020/21 and 2021/22, councils' capital expenditure for renewals was 78% of depreciation. In 2022/23, councils' capital expenditure for renewals was 76% of depreciation.
4.3
Since 2012/13, for every $1 of assets run down, councils have annually reinvested between 74 and 89 cents.
4.4
The performance of councils as a whole in this regard remains significantly less than 100%, which indicates that councils are not replacing their assets at the same rate as they are being run down.
4.5
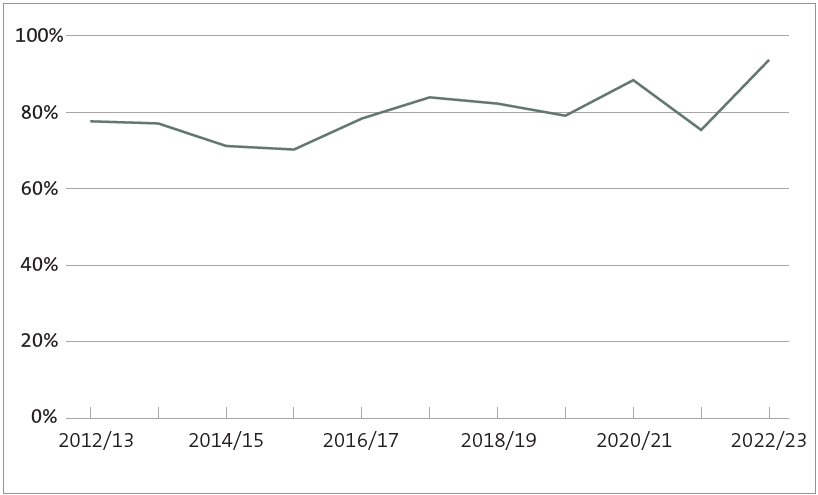
In 2022/23, councils' total capital expenditure was $7 billion. This was a significant increase from the previous year, and it is the most councils have spent on their assets in the last 11 years. The amount spent (94% of the $7.5 billion budgeted) was also the largest spending as a proportion of budget in the last 11 years (and a significant increase from the 76% of the budgeted amount spent in 2021/22).
4.6
Council debt increased by $5.4 billion (26%) to $26 billion in the last two years. This is broadly consistent with the amount councils budgeted to hold at 30 June 2023. This increase indicates that councils as a whole are increasingly using debt to invest in assets. Despite this increase in debt, we have not seen a significant decline in councils' financial sustainability.
Reinvestment in councils' assets
4.7
We compared capital expenditure on renewing assets with annual depreciation to see how much councils are reinvesting in their assets. We consider depreciation to be a reasonable way of estimating the portion of the asset that was run down during a financial year. However, because assets have long life cycles, this is only one indicator of whether councils are reinvesting enough.41
4.8
Councils' underinvestment in their assets increases the risk of asset failure. In turn, this increases the risk of a reduction in the quality of services that councils provide to their communities. Based on our analysis of the 2021/22 and 2022/23 audit results, we remain concerned that councils as a whole might not be reinvesting enough in their critical assets.
4.9
Many councils have recently adopted their 2024-34 long-term plans or are preparing information for their 2025-34 long-term plans.42 This is an opportunity for them to re-examine how much they are reinvesting in their assets.
4.10
We will report on the findings from our audits of these long-term plans and consider whether councils are planning to reinvest more in their assets.
Reinvestment in assets remains less than what has been run down
4.11
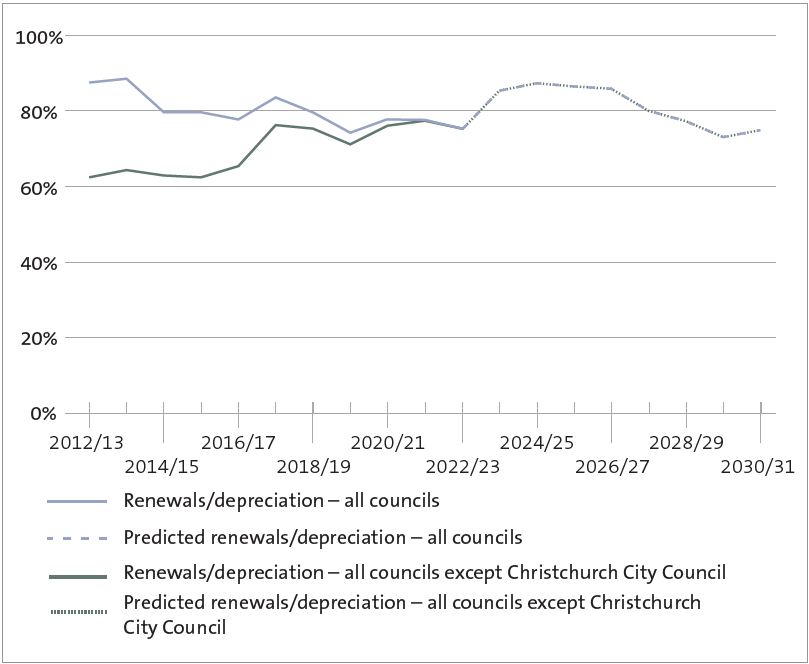
Figure 15 compares actual renewal capital expenditure with depreciation for all councils, from 2012/13 to 2022/23. It also shows the predicted renewal capital expenditure for the period of the 2021-31 long-term plans.
4.12
There are two lines on the graph: one that includes all councils and one that excludes Christchurch City Council. Christchurch City Council's renewal capital expenditure was proportionately higher than other councils because of the rebuilding it has done since the 2011 Canterbury earthquakes.
4.13
However, the effect of this has been decreasing over time. After 2020/21, this difference is no longer notable.
Figure 15
Renewal capital expenditure compared with depreciation for all councils, actual percentages for 2012/13 to 2022/23 and predicted percentages for 2023/24 to 2030/31
Source: Analysed from information collected from councils' annual reports and 2021-31 long-term plans.
4.14
For the 19 years of actual and predicted results in Figure 15, council renewal expenditure remains less than 100% of depreciation.
4.15
In both 2020/21 and 2021/22, the combined renewal capital expenditure of all councils was 78% of depreciation. In 2022/23, it was 76%.
4.16
Between 2012/13 and 2022/23, renewal capital expenditure of all councils ranged from 74% to 89% of depreciation. In dollar terms, councils have cumulatively spent $5.5 billion less on renewal capital expenditure than they have recognised as depreciation. However, when excluding the performance of Christchurch City Council's renewal capital expenditure, the percentage is much lower.
4.17
Excluding Christchurch City Council, renewal capital expenditure of councils ranged from 63% to 78% of depreciation between 2012/13 and 2022/23. Cumulatively, renewal capital expenditure was $7.3 billion less than depreciation.
4.18
Our analysis of councils' 2021-31 long-term plans shows that there is a step change expected from 2023/24, when councils' renewal investment is predicted to range from 86% to 88% for the next four financial years. However, this is forecast to steadily decline to 73% by 2029/30.
Some individual councils are reinvesting more than has been run down
4.19
Looking at a council's performance for an individual year does not generally provide a good view of how well councils are reinvesting in their assets. This is because the rate of asset renewal can spike (especially when large-value assets such as bridges and treatment plants are renewed).
4.20
Depreciation, in contrast, is spread evenly over the life cycle of an asset. Therefore, we expect that the rate of asset renewals over a period of time (generally the life cycle of an asset) will align with depreciation for that period.
4.21
Figure 16 looks at the performance of individual councils between 2012/13 and 2022/23. It shows that 21 councils spent, in total, more on renewing assets than they lost through use.43
Figure 16
Average renewal capital expenditure compared with depreciation, 2012/13 to 2022/23
| Average renewals compared to depreciation for 2012/13 to 2022/23 | Number of councils |
|---|---|
| Greater than 100% | 21 |
| Between 90% and 100% | 9 |
| Between 80% and 90% | 10 |
| Between 70% and 80% | 12 |
| Between 60% and 70% | 17 |
| Less than 60% | 9 |
Source: Analysed from information collected from councils' annual reports.
4.22
These councils tended to be regional councils (who are responsible for less infrastructure) or smaller rural councils.44 This group also includes councils that were significantly affected by natural disasters such as earthquakes. Damage caused by earthquakes in 2011 and 2016 meant that these councils needed to reinvest in their infrastructure to enable key services to continue.45
4.23
Nine councils renewed less than 60% of their depreciation between 2012/13 and 2022/23.46 Six of these nine councils were provincial councils. It is unclear to us why they have renewed relatively less than depreciation compared to other councils.
4.24
However, some of these councils are managing significant growth in their districts, which includes needing to build new assets. Newer assets do not require as much reinvestment as older assets.
Councils' reinvestment in assets has historically not met their budgets
4.25
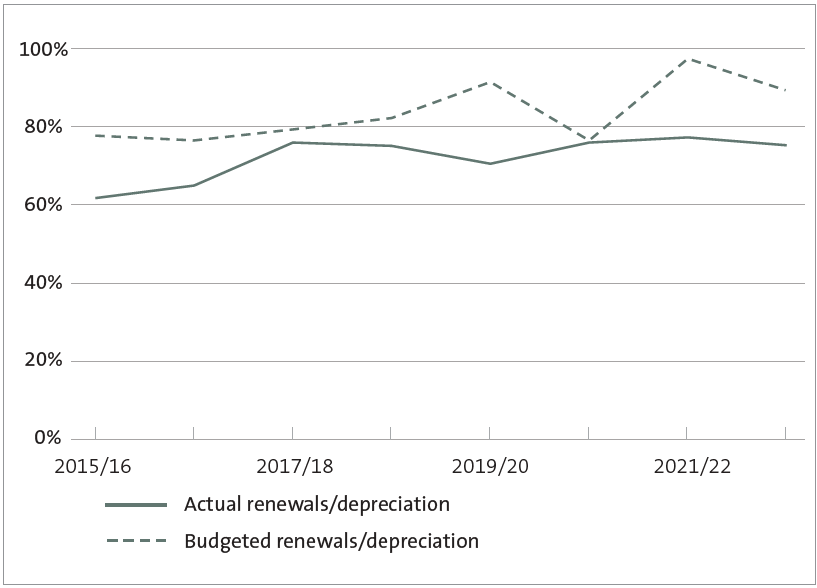
Councils have generally budgeted to reinvest more in assets than they have actually spent. Figure 17 sets out budgeted and actual renewal capital expenditure with depreciation for all councils (except for Christchurch City Council) from 2015/16 to 2022/23.
Figure 17
Actual and budgeted renewal capital expenditure compared with depreciation for all councils excluding Christchurch City Council, 2015/16 to 2022/23
Source: Analysed from information collected from councils' annual reports and long-term plans.
4.26
We excluded Christchurch City Council because its renewal capital expenditure was proportionately higher than other councils as a result of the rebuilding it has done since the 2011 Canterbury earthquakes. Excluding Christchurch City Council gives a more accurate picture of the reinvestment councils have made in their assets.
4.27
Figure 17 shows that, every year, councils as a whole (except for Christchurch City Council) budgeted for renewals to be less than depreciation.
4.28
Figure 17 also shows that, every year, the budgeted proportion of renewals to depreciation is higher than the actual proportion of renewals to depreciation. The largest margins between budgeted and actual were in 2019/20 (21%) and 2021/22 (20%). In 2022/23, the margin between budgeted and actual was 14%.
4.29
For most years, the reason that councils did not meet their renewals goal was because they did not deliver on their capital expenditure budgets. For example, councils (except for Christchurch City Council) reinvested $2.1 billion in their assets in 2021/22, which was less than the $2.6 billion budgeted.
4.30
In 2022/23, actual renewals capital expenditure was $2.4 billion compared to budgeted renewals capital expenditure of $2.6 billion (excluding Christchurch City Council). However, the underspend in this case was smaller. Councils' depreciation expense increased significantly, reflecting updated expectations of the amount of assets that would be run down in 2022/23.
4.31
The analysis in paragraphs 4.25 to 4.30 shows that, based on historic performance, it will be challenging for councils to achieve the predicted renewal capital expenditure outlined in Figure 15. We discuss how well councils delivered their capital expenditure programmes in paragraphs 4.43 to 4.50.
Council reinvestment in different classes of infrastructure
4.32
In the previous years, we found that renewals spending as a proportion of depreciation expense is lower for three waters infrastructure than for other infrastructure. This trend has partly changed when looking at councils' reinvestment in their assets for 2021/22 and 2022/23.
4.33
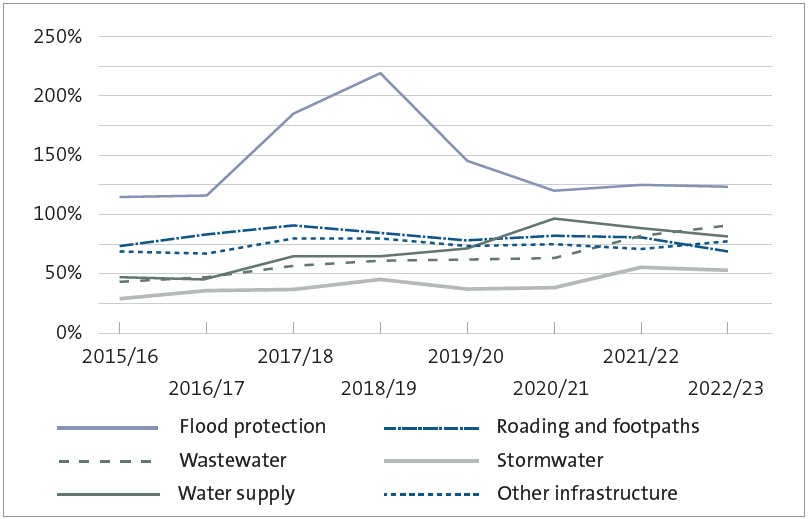
Figure 18 sets out the renewal capital expenditure compared with depreciation by type of infrastructure owned by councils for 2015/16 to 2022/23. Figure 18 does not include Christchurch City Council (as discussed in paragraph 4.12, this is because of the rebuilding it has done since the 2011 Canterbury earthquakes).
4.34
We have included "other infrastructure" in Figure 18. Other infrastructure covers all other assets owned by councils that are not separately shown in Figure 18. Other infrastructure includes assets such as community facilities, ports (airports and seaports), and public transport assets (buses and trains).47
Figure 18
Renewal capital expenditure compared with depreciation for all councils excluding Christchurch City Council by type of infrastructure asset category, 2015/16 to 2022/23
Source: Analysed from information collected from councils' annual reports.
4.35
Figure 18 shows that reinvestment in flood protection infrastructure was consistently above depreciation from 2015/16 to 2022/23. All other categories of infrastructure reinvestment remained less than depreciation.
4.36
Despite this, there has been a steady improvement in the amount that councils have reinvested into three waters' infrastructure since 2015/16, with:
- stormwater supply renewals increasing from 30% of depreciation in 2015/16 to 53% of depreciation in 2022/23;
- water supply renewals increasing from 48% of depreciation in 2015/16 to 81% of depreciation in 2022/23; and
- wastewater supply renewals increasing from 44% of depreciation in 2015/16 to 91% of depreciation in 2022/23.
4.37
This steady improvement reflects that councils are particularly focusing on reinvesting in three waters, which was set out in the 2021-31 long-term plans.48
4.38
The level of investment in stormwater infrastructure remains lower than in water supply and wastewater infrastructure – renewals were 56% of depreciation for 2021/22 and 53% of depreciation in 2022/23. We have previously reported on our concerns with the level of investment in stormwater infrastructure.49
4.39
Councils need to consider increasing their investment in stormwater infrastructure, as it is likely that there will be more heavy rainfall events in New Zealand that will put pressure on stormwater systems.
4.40
Renewals in roading infrastructure peaked at 92% of depreciation in 2017/18 and declined to 69% in 2022/23. Councils' reinvestment in their local roads has generally been high, partly because Waka Kotahi provides co-funding.
4.41
In our view, the steep decline in 2022/23 is related to councils updating their depreciation estimates in 2022/23, rather than any decrease in renewals. Renewal expenditure for roading infrastructure increased by $0.1 billion between 2021/22 and 2022/23.50 It is likely that councils' future reinvestment in local roads will need to increase in line with the recent changes in depreciation to maintain services.
Looking forward
4.42
When we wrote this report, many councils were in the process of finalising their long-term plans. In preparing these plans, councils will review their planned reinvestment in infrastructure. The change in level of reinvestment is a matter that we will consider when we analyse and report on these long-term plans.
Delivery of capital expenditure programmes
4.43
In 2020/21, we reported that most councils did not deliver all their capital expenditure programmes.51 This continues to be the case in 2021/22 and 2022/23. As a result, some capital projects either have been delayed or are not being delivered at all. This could affect the levels of service that councils provide to their communities.
4.44
Councils' total capital expenditure in 2021/22 was $5.8 billion, which was consistent with 2020/21. The amount spent in 2021/22 was 76% of the $7.68 billion budgeted, 12% less than the amount spent against budget in 2020/21 (88% of $6.58 billion budgeted).52
4.45
Councils' total capital expenditure in 2022/23 increased significantly to $7 billion, which is the most councils have spent on their assets in the last 11 years (see Figure 19). The amount spent was 94% of the $7.5 billion budgeted. This was the largest spending as a proportion of budget in the last 11 years and a significant increase from 76% in 2021/22.
Figure 19
Average percentage of capital expenditure budget spent for all councils, 2012/13 to 2022/23
Source: Analysed from information collected from councils' annual reports.
4.46
On average, all council subsectors spent less than 100% of their total capital expenditure budgets in 2021/22. This was also the case in 2020/21. In 2021/22, regional councils spent $185 million or 57% (on average) of their capital expenditure budget. By comparison, in 2021/22, Auckland Council spent $1.8 billion or 78% of its capital expenditure budget.
4.47
In 2022/23, Auckland Council spent 107% of its capital expenditure budget (or $2.32 billion). All other subsectors spent less than 100% of their capital expenditure budgets in 2022/23. Consistent with the previous year, regional councils spent the lowest in 2022/23 – $262 million or, on average, 69% of their budget.
4.48
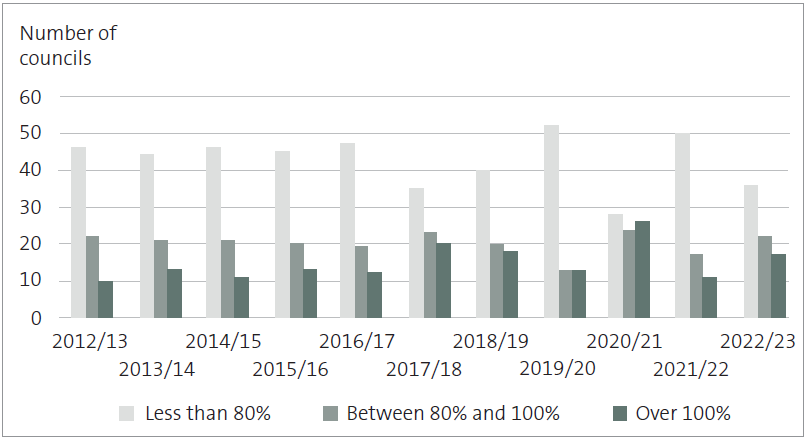
In 2021/22, 50 councils spent less than 80% of their capital expenditure budgets. This is a significant increase from the 28 councils in 2020/21 and is close to the highest number in this category in the last 11 years (as Figure 20 shows, the highest was 52 councils in 2019/20). However, in 2022/23, 36 councils spent less than 80% of their capital expenditure budgets.
Figure 20
Number of councils spending less than 80%, between 80% and 100%, and more than 100% of their budgeted capital expenditure, 2012/13 to 2022/23
Source: Analysed from information collected from councils' annual reports.
4.49
This indicates that, overall, councils still face challenges in delivering their capital expenditure programmes. Key challenges include ongoing inflationary pressures and resource constraints throughout the local government sector.
4.50
We expect councils to continue to seek to address historical underinvestment in their infrastructure, in accordance with their 2021-31 long-term plans. We also expect councils to continue focusing on having properly scoped and realistic capital programmes. This is a focus for our audits of their long-term plans.
Debt and financial sustainability
4.51
Councils generally use debt to fund capital expenditure. This is appropriate given the long-term nature of public assets, because it allows future generations to share these costs. In the last two financial years, the total amount of debt for all councils continued to increase.
Council debt continues to increase
4.52
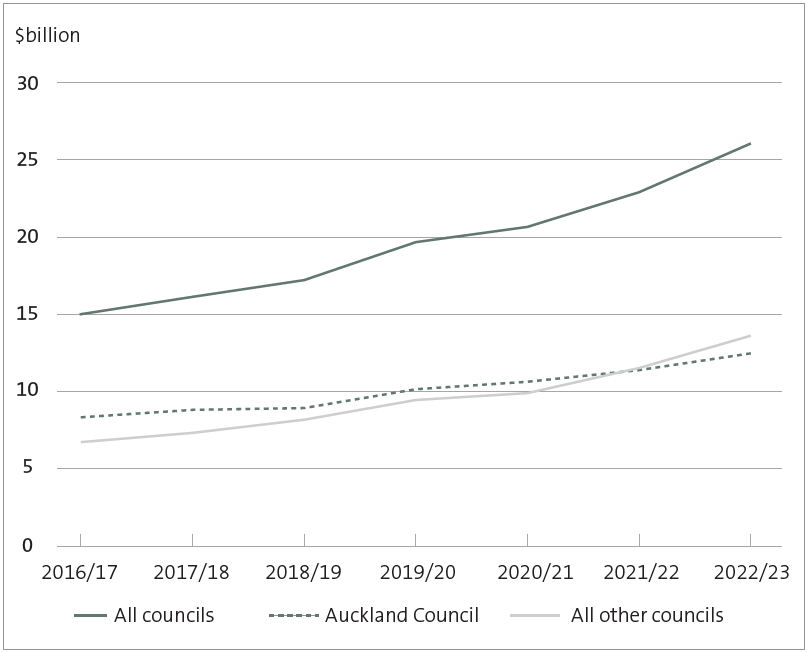
Figure 21 sets out the amount of debt held by councils from 2016/17 to 2022/23. Figure 21 also shows Auckland Council's debt separately from other councils' debt. We separated Auckland Council's debt from other councils because it has historically accounted for more than 50% of the total debt for all councils.
Figure 21
Council debt, 2016/17 to 2022/23
Source: Analysed from information collected from councils' annual reports.
4.53
Figure 21 shows that all council debt was $26 billion in 2022/23. This compares to $22.9 billion in 2021/22 and $20.6 billion in 2020/21. All council debt has increased by $5.4 billion (26%) in the last two financial years.
4.54
In 2022/23, all council debt (excluding Auckland Council) increased by 36% to $13.5 billion. In contrast, Auckland Council debt increased at a slower rate of 17% to $12.5 billion in the same financial year. Since 2021/22, other council debt has been more than Auckland Council's debt.
4.55
The increase in council debt during the last two years was mainly to fund investment in infrastructure. During the last two years, councils have invested $12.8 billion in their assets (see paragraphs 4.43 to 4.50).
4.56
In our report on the matters arising from our audits of the 2021-31 long-term plans, we stated that council debt was forecast to increase during the 10-year period to 2031.53 We are seeing this trend play out.
4.57
Despite the increase in council debt during the last two years, it was still below budgeted levels. Debt was 8% less than budgeted in 2021/22, and it was 1% less than budgeted in 2022/23. Because councils as a whole did not achieve their budgeted capital expenditure in these two years (see Figure 19), this is not unexpected.
4.58
In 2022/23, council debt (excluding Auckland Council) was 5% less than budgeted. In comparison, Auckland Council's debt in 2022/23 was $0.4 billion (or 3%) more than budgeted.
4.59
Auckland Council's annual report said that debt was more than planned because of working capital movements and foreign exchange movements.54 The Council also reported on 31 August 2023 that it had sold a portion of its shareholding in Auckland International Airport Limited with the intention of reducing its debt.55
4.60
Given the increase in council debt, Figure 22 sets out how much debt is carried by all councils other than Auckland Council. We have focused on the last three financial years, reflecting the significant increase described in Figure 21.
4.61
Figure 22 shows that most councils' debt increased during the last two years. By 30 June 2023, 34 councils had more than $100 million in debt (excluding Auckland Council), 10 more than in 2020/21. In comparison, 15 councils had debt less than $25 million (10 fewer than in 2020/21).
4.62
Auckland Council, Christchurch City Council, and Wellington City Council had more than $1 billion of debt as at 30 June 2023. These three councils had 61% of the total council debt.
Figure 22
Levels of debt by number of councils (excluding Auckland Council) for 2020/21, 2021/22, and 2022/23
| Debt | 2020/21 | 2021/22 | 2022/23 |
|---|---|---|---|
| More than $1 billion | 1 | 2 | 2 |
| $500 million to $1 billion | 4 | 3 | 4 |
| $250 to $500 million | 1 | 5 | 6 |
| $100 to $250 million | 18 | 18 | 22 |
| $50 to $100 million | 15 | 15 | 12 |
| $25 to $50 million | 13 | 16 | 13 |
| $0 to $25 million | 20 | 16 | 14 |
| No debt | 5 | 2 | 1 |
Note: The 2022/23 results do not include Buller District Council, Rotorua District Council, or West Coast Regional Council because the audited annual reports for these councils were not available when we did our analysis.
Source: Analysed from information collected from councils' annual reports.
How debt is affecting the financial sustainability of councils
4.63
Given the increase in debt, we are interested in the overall financial sustainability of councils. Therefore, we looked at the financial reporting and prudence benchmarks (the prudence benchmarks).
4.64
The Local Government (Financial Reporting and Prudence) Regulations 2014 (the Regulations) require councils to prepare prudence benchmarks. Prudence benchmarks are intended to improve the ability of ratepayers and stakeholders to assess a council's financial health and compare it with other councils.
4.65
For this report, we have looked at two benchmarks that the Regulations require. They are:
- the debt affordability benchmark, which compares actual debt with a council's quantified limit (or limits)56 on debt specified in the council's long-term plan; and
- the balanced budget benchmark, which compares the amount of revenue generated with the amount of operating expenses.57, 58
4.66
We chose these benchmarks because they indicate a council's level of indebtedness and whether a council is generating enough revenue to cover its costs.
Almost all councils are within their debt affordability benchmarks
4.67
From our review of the debt affordability benchmarks disclosed by councils, we found that one council did not meet this benchmark in the last five financial years.
4.68
Ruapehu District Council set its debt limit at twice its annual rates revenue. It reported that it was above the debt limit in the debt affordability benchmark for 2022/23. Despite this, the Council reported that other limits on borrowing set in its Treasury Management Policy were in the "acceptable range".
4.69
The other councils are within the limits described in their debt affordability benchmarks. Despite that, some councils are beginning to get close to, or remain close to, their debt limit.
4.70
These councils need to actively monitor the amount of debt they borrow to ensure that they remain prudent. They may also be constrained by how much they can reinvest in their assets or respond to unexpected events (such as natural disasters).
More councils are not meeting the balanced budget benchmark
4.71
In every year since 2018/19, some councils did not meet their balanced budgeted benchmark. This meant that these councils were not generating enough revenue to cover their ongoing operational costs. In 2022/23, the number of councils that did not meet their balanced budget benchmark increased significantly (see Figure 23).
4.72
The number of councils that did not meet their balanced budget benchmark in 2022/23 is the highest in the last five years. We expect that this is partly because some councils underestimated how much their expenditure increased because of inflation when setting how much revenue to recover through rates, fees, and charges.
Figure 23
Number of councils that did not meet their balanced budget benchmark, from 2018/19 to 2022/23
| Year | Number of councils not meeting the benchmark |
|---|---|
| 2018/19 | 26 |
| 2019/20 | 36 |
| 2020/21 | 19 |
| 2021/22 | 27 |
| 2022/23 | 45 |
Note: The number of councils reported above do not include Buller District Council, Rotorua District Council, or West Coast Regional Council because the audited annual reports for these councils were not available when we did our analysis.
Source: Analysed from information collected from councils' annual reports.
4.73
Some councils consistently do not meet their balanced budget benchmark. During the last five years, seven councils did not meet their balanced budget benchmark for the entire five years.59 A further eight councils did not meet their balanced budget benchmark for four of the last five years.60
4.74
The most common reasons these councils gave for not meeting the balanced budget benchmark was that they were not "fully funding" depreciation or that they had incurred costs that they had not planned for.61 If councils are not fully funding depreciation, they may not have enough funds to replace the assets when they need to.
4.75
The councils that did not meet the balanced budget benchmark did not always explain why this had happened in their annual report. Although the Regulations do not require them to do so, we consider that it is good practice for councils to be transparent about why they did not meet the balanced budget benchmark or any other prudence benchmarks in their annual report.
4.76
Hutt City Council explained why it did not meet the balanced budget benchmark in its annual report. The Council also set out when it was forecasting to meet the benchmark.62 We encourage other councils that do not meet the benchmark to also explain why and when they expect to meet it.
4.77
We will consider and analyse how increasing debt levels are affecting the financial sustainability of councils when we report on their long-term plans.
Councils need to take due care when preparing their financial reporting and prudence benchmarks
4.78
When reviewing the debt affordability benchmark disclosures in councils' annual reports, we identified several errors with how they were reported. These errors included:
- not reporting all debt limits contained in the financial strategy;
- presenting reported debt limits that were not included in the financial strategy;
- presenting graphs with incorrectly calculated or incorrectly presented results;
- presenting graphs that did not follow the format that the Regulations require;
- presenting graphs that did not align with the text supporting them; and
- presenting graphs that were incorrectly labelled.
4.79
We found that one council reported that it had not met one of its debt affordability benchmarks when in fact it did.
4.80
These errors show that councils need to take due care when preparing the prudence benchmark disclosures. Incorrectly presented information might mean that readers of councils' annual reports form the wrong conclusions about the council's financial prudence. Our auditors have also been reminded of the importance of these disclosures.
40: Our 2022/23 analysis excludes Buller District Council, Rotorua District Council, and West Coast Regional Council. This is because the audited annual reports for these councils were not available when we did our analysis. These councils remain in the previous year results because we considered that they were too small to impact our analysis.
41: Our comparison of depreciation with renewals is used as an indicator only. We expect any difference between the two to reduce over the life of an asset. When there is high growth, a higher proportion of capital expenditure is on non-renewal assets. Therefore, as a percentage of depreciation, renewals will trend downwards over time as non-renewal assets are capitalised.
42: The Water Services Acts Repeal Act 2024 gave affected councils the option to defer preparation of their 2024-34 long-term plans for one year. Councils that chose this option have to prepare a 2025-34 long-term plan. When we wrote this report, we were aware that some councils had chosen this option.
43: These councils were Bay of Plenty Regional Council, Buller District Council, Central Hawke's Bay District Council, Christchurch City Council, Environment Canterbury, Gisborne District Council, Hawke's Bay Regional Council, Horizons Regional Council, Kaikōura District Council, Mackenzie District Council, Northland Regional Council, Ōpōtiki District Council, Ruapehu District Council, Taranaki Regional Council, Timaru District Council, Waikato District Council, Waikato Regional Council, Waimakariri District Council, Wairoa District Council, Waitomo District Council, and West Coast Regional Council.
44: Sixteen of the 21 councils are rural or regional councils.
45: Christchurch City Council, Environment Canterbury, Kaikōura District Council, and Waimakariri District Council's renewals were all greater than depreciation. The infrastructure owned by these councils experienced significant damage after the 2011 Canterbury earthquakes and the 2016 Hurunui/Kaikōura earthquake.
46: These councils were Kāpiti Coast District Council, Nelson City Council, Otago Regional Council, Selwyn District Council, Taupō District Council, Tauranga City Council, Thames-Coromandel District Council, Upper Hutt City Council, and Western Bay of Plenty District Council.
47: For further information on the other types of infrastructure councils own, see Part 4 of Controller and Auditor-General (2022), Matters arising from our audits of the 2021-31 long-term plans, at oag.parliament.nz.
48: See Part 4 of Controller and Auditor-General (2022), Matters arising from our audits of the 2021-31 long-term plans, at oag.parliament.nz.
49: See Controller and Auditor-General (2018), Managing stormwater systems to reduce the risk of flooding, at oag.parliament.nz.
50: These amounts exclude the roading renewals spent by Christchurch City Council. If these were included, the amount of renewal expenditure would remain steady at $0.8 billion in both years.
51: Controller and Auditor-General (2022), citeem>Insights into local government: 2021, at oag.parliament.nz.
52: This information is from the statement of cash flows of councils. It includes only the cash that councils spent on purchasing property, plant, and equipment, and intangible assets.
53: Controller and Auditor-General (2022), Matters arising from our audits of the 2021-31 long-term plans, at oag.parliament.nz.
54: Auckland Council (2023), Auckland Council Annual Report 2022/23, Volume 3, page 59. Auckland Council also reported that its debt included $252 million of unrealised foreign exchange losses on debt that were denominated in foreign currencies. These losses have been hedged using derivative financial instruments and will not result in a loss in economic terms.
55: Auckland Council (2023), Auckland Council Annual Report 2022/23, Volume 3, page 99. Auckland Council reported that this yielded $833 million, net of any fees, and was $32 million (or 4%) below the budgeted proceeds of $865 million.
56: The Regulations allow councils to have more than one debt affordability benchmark. For more information on the types of debt affordability benchmarks councils use, see Part 2 of Controller and Auditor-General (2022), Matters arising from our audits of the 2021-31 long-term plans, at oag.parliament.nz.
57: The Regulations specify that the revenue used in the calculation excludes development contributions, financial contributions, vested assets, gains on derivative financial instruments, and revaluations of property, plant, or equipment.
58: The Regulations specify that the operating expenses used in the calculation exclude losses on derivative financial instruments and revaluations of property, plant, or equipment.
59: These councils were Hutt City Council, Matamata-Piako District Council, New Plymouth District Council, Otago Regional Council, Upper Hutt City Council, Waimakariri District Council, and Waitaki District Council.
60: These councils were Clutha District Council, Horowhenua District Council, Hurunui District Council, Kawerau District Council, Napier City Council, Queenstown-Lakes District Council, Selwyn District Council, and South Wairarapa District Council.
61: Where a council's total depreciation is not covered by an equivalent amount of revenue, we say that the council is not "fully funding" depreciation.
62: See Hutt City Council (2023), Pūrongo ā-Tau Annual Report 2022-23, page 30.

