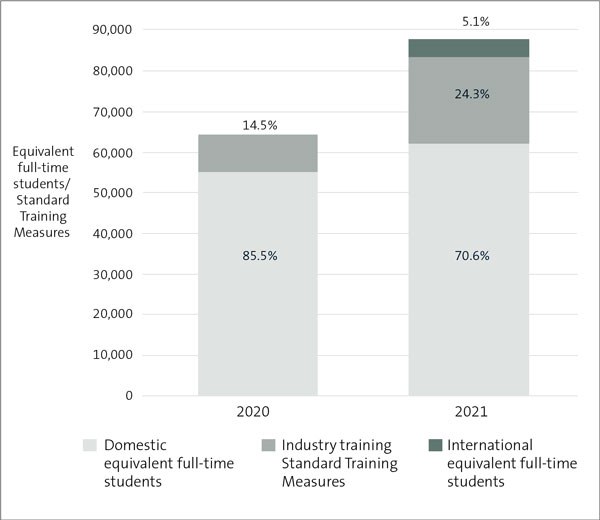
Figure 19: Equivalent full-time students and Standard Training Measures at Te Pūkenga, from 2020 to 2021
Stacked bar chart showing composition of equivalent full-time students at Te Pūkenga. In 2020, 85.5% of equivalent full-time students at Te Pūkenga were domestic students and 14.5% were Industry training Standard Training Measures. In 2021, 70.6% were domestic students, 24.3% were Industry training Standard Training Measures, and 5.1% were international students.
https://oag.parliament.nz/2023/tei-audit-results/gfx/figure19.jpg/view
https://oag.parliament.nz/2023/tei-audit-results/gfx/figure19.jpg/@@download/image/figure19.jpg
Figure 19: Equivalent full-time students and Standard Training Measures at Te Pūkenga, from 2020 to 2021
Stacked bar chart showing composition of equivalent full-time students at Te Pūkenga. In 2020, 85.5% of equivalent full-time students at Te Pūkenga were domestic students and 14.5% were Industry training Standard Training Measures. In 2021, 70.6% were domestic students, 24.3% were Industry training Standard Training Measures, and 5.1% were international students.

