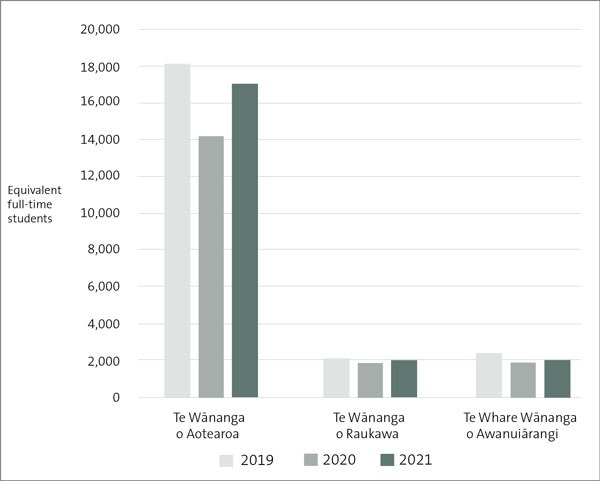
Figure 16: Total equivalent full-time students at wānanga, from 2019 to 2021
Bar chart showing total equivalent full-time students at wānanga from 2019 to 2021. It shows that all wānanga experienced a small decrease in students from 2019 to 2020, but numbers increased again in 2021
https://oag.parliament.nz/2023/tei-audit-results/gfx/figure16.jpg/view
https://oag.parliament.nz/2023/tei-audit-results/gfx/figure16.jpg/@@download/image/figure16.jpg
Figure 16: Total equivalent full-time students at wānanga, from 2019 to 2021
Bar chart showing total equivalent full-time students at wānanga from 2019 to 2021. It shows that all wānanga experienced a small decrease in students from 2019 to 2020, but numbers increased again in 2021

