Part 6: Universities' financial results and enrolments
6.1
In this Part, we discuss how the financial position of universities has changed over the last few years.
6.2
The border closures in response to the Covid-19 pandemic have decreased the number of international student enrolments at universities. However, in our report Tertiary education institutions: What we saw in 2021, we noted that the decrease in the number of international student enrolments did not affect universities as significantly as we anticipated.
Main financial results
6.3
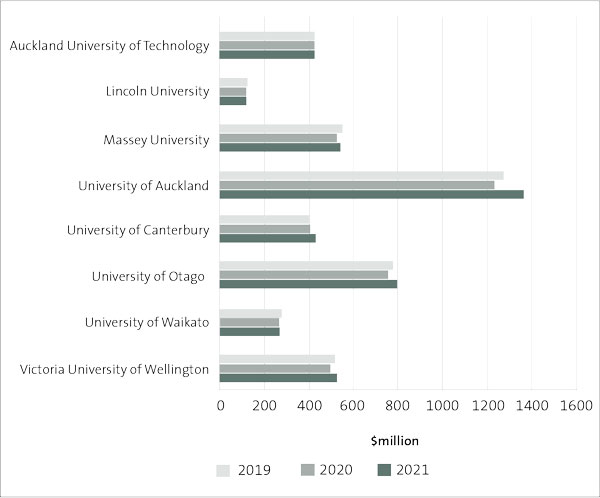
Figure 4 shows that every university except the University of Canterbury earned less revenue in 2020 than in 2019. Figure 4 also shows that every university except the Auckland University of Technology earned more revenue in 2021 than in 2020. This was due to an increase in domestic enrolments across the tertiary education sector in 2021.
6.4
The border closures and lockdowns in 2020 occurred after the start of the academic year. This meant a significant proportion of international students were already enrolled and in the country.
6.5
However, there was a large difference between the enrolment trends of domestic and international students. There was an 8.9% increase in domestic students in the universities between 2019 and 2021.31 There was a 23% decrease in international student enrolments in the same period.32
Figure 4
Revenue for universities, from 2019 to 2021
6.6
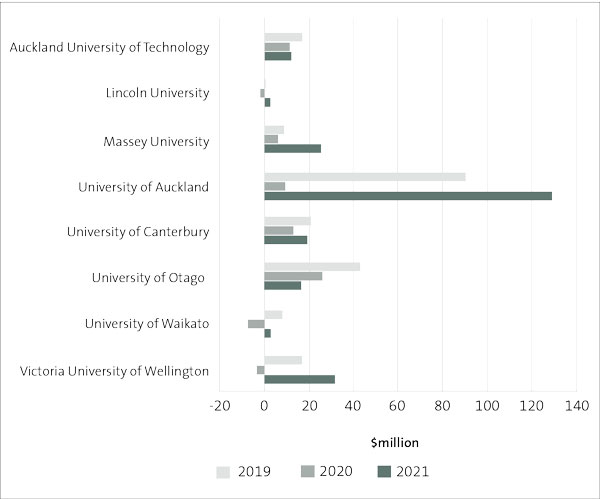
All universities recorded a financial surplus in 2019. Figure 5 shows that the sector-wide surplus decreased in 2020, with three universities ending the year with deficits. However, all the universities recorded a surplus in 2021 due to an overall increase in domestic enrolments.
Figure 5
University surpluses/deficits, from 2019 to 2021
6.7
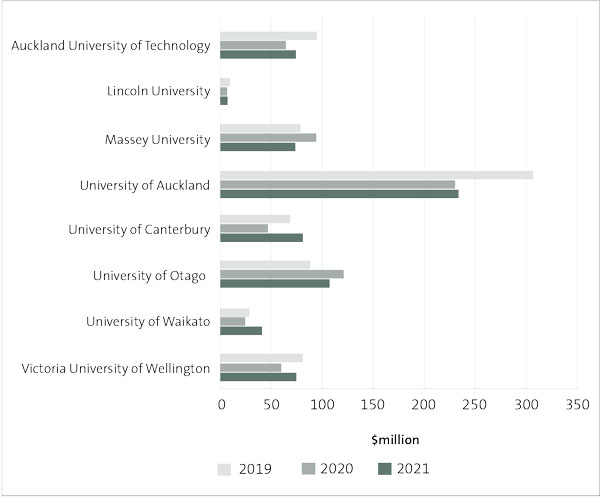
Figure 6 shows that all universities have had consistently positive operating cash flows from 2019 to 2021. Generally positive operating cashflows means that, all other things being equal, the organisation is generating enough cash to meet its operating obligations. Therefore, it is less likely to rely on debt or other sources of funding to be financially sustainable. The decrease in international enrolments in 2020 negatively affected university surpluses (see Figure 9). However, due to the increase in domestic enrolments, all universities reported surpluses in 2021.
Figure 6
University cash flows from operations, from 2019 to 2021
6.8
TEC has a framework for monitoring the financial viability of TEIs.33 It sets risk thresholds for each of the measures in the framework. One measure TEC uses is "surplus as a percentage of revenue". Its low-risk threshold (that is, performing as, or better than expected) is 3% or more.
6.9
We list the surplus as a percentage of revenue for each university for 2021:
- University of Auckland – 9.5%.
- Victoria University of Wellington – 6%.
- Massey University – 4.6%.
- University of Canterbury – 4.4%.
- Auckland University of Technology – 2.9%.
- Lincoln University – 2.4%.
- University of Otago – 2.1%.
- University of Waikato – 1.1%.
6.10
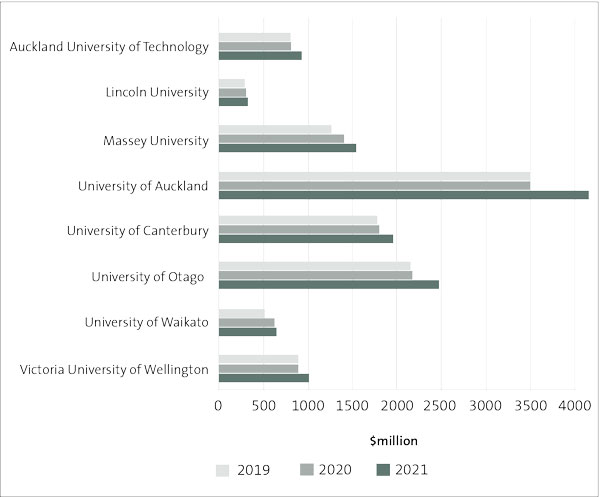
Equity is the difference between a public organisation's assets and its liabilities. Therefore, the net assets of an organisation represent the ownership interest of taxpayers. Figure 7 shows that all universities except Victoria University of Wellington had more equity in 2020 than in 2019. It also shows that equity increased for all universities in 2021 – a total increase of $1.5 billion from 2020 to 2021.
Figure 7
University equity, from 2019 to 2021
6.11
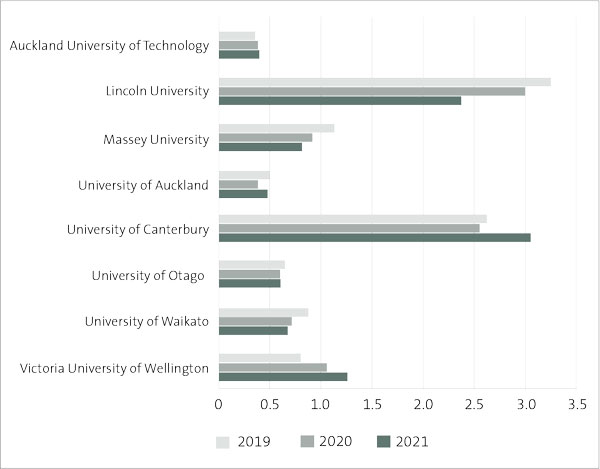
The current ratio is a liquidity ratio that measures an organisation's ability to pay short-term obligations or obligations due within one year. Figure 8 shows that five universities had current ratios of less than 1 in 2021, which is consistent with 2020. A current ratio of less than 1 means that an organisation's current assets are less than its current liabilities.
6.12
Current ratios are only one measure of an organisation's ability to meet obligations as they fall due. Because of the overall financial standing of universities, the low current ratios might not be concerning. However, they do require active management.
Figure 8
University current ratios, from 2019 to 2021
Enrolments
6.13
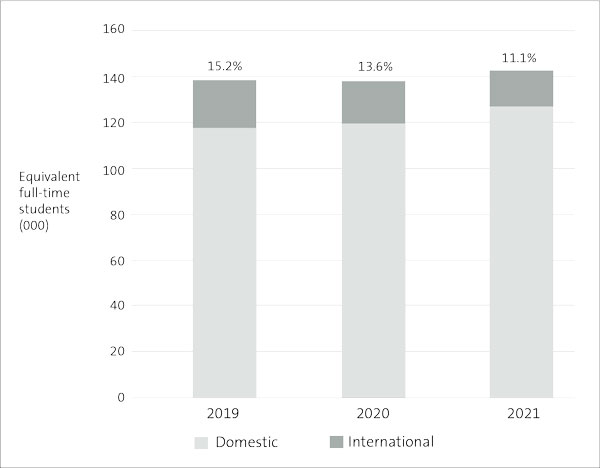
Figure 9 shows that the total number of EFTS at universities remained reasonably consistent – in 2019 there were 138,590 EFTS and in 2020 there were 138,135 EFTS.
6.14
In 2021, the total number of EFTS increased to 142,760. This was due to a significant increase in domestic enrolments as international enrolments continued to decline due to border restrictions.
Figure 9
Total domestic equivalent full-time students and the percentage of international equivalent full-time students at universities, from 2019 to 2021
Source: Data collected from universities' annual reports.
6.15
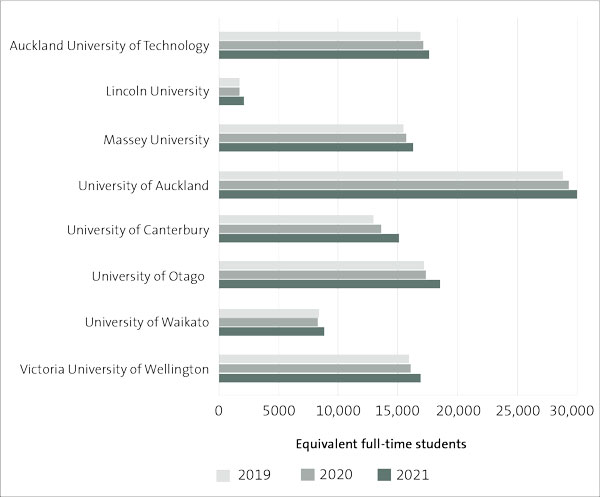
The number of domestic EFTS has increased over the last few years. Figure 10 shows that all but one university had an increase in domestic EFTS from 2019 to 2020. All universities had an increase in the number of domestic enrolments between 2020 and 2021.
6.16
The Ministry of Education released a report in December 2021 on how the Covid-19 pandemic has affected tertiary education.34 The report notes that some broad trends in participation have become apparent. There was a large increase in domestic enrolments in 2021, both at tertiary education providers and in workplace-based training. The closing of the border resulted in a significant decrease in the number of international students attending tertiary institutions.
Figure 10
Domestic equivalent full-time students at universities, from 2019 to 2021
Source: Data collected from universities' annual reports.
6.17
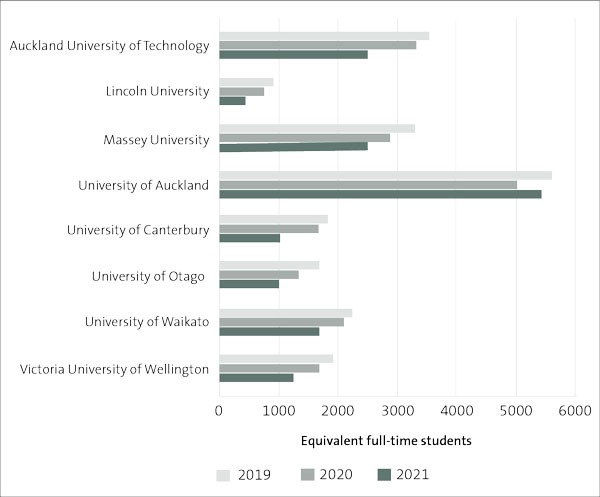
Figure 11 shows that every university had a decrease in international EFTS between 2019 and 2020. The decrease in international EFTS continued into 2021 as border restrictions continued. The one exception was the University of Auckland, which saw an increase in international EFTS in 2021. This was due to significant efforts to facilitate offshore/remote enrolment, as well as working with overseas partners to establish learning centres in China and Vietnam.35
Figure 11
International equivalent full-time students at universities, from 2019 to 2021
Source: Data collected from universities' annual reports.
Conclusion
6.18
The Covid-19 pandemic has affected universities, most notably through the decrease in international student enrolments. However, universities have not been as significantly affected as anticipated due to a significant increase in domestic enrolments in 2021. This more than offset the decrease in international enrolments for the same year. All universities have generally ended 2021 in an improved financial position compared with 2020.
6.19
However, as at August 2022, total university enrolments for the year were 134,235 EFTS compared with 142,760 as at August 2021. Although universities might be able to absorb short-term revenue reductions, they will need to reconsider their medium to long-term forecasts to ensure that they take account of further uncertainty and disruptions to the learning environment.
31: See spreadsheet of provider-based enrolments "sheet ENR.10", at educationcounts.govt.nz.
32: See spreadsheet of provider-based enrolments "sheet ENR.10", at educationcounts.govt.nz.
33: Tertiary Education Commission (2016), Financial Monitoring Framework Guidelines for Tertiary Education Institutions, at tec.govt.nz.
34: Ministry of Education (2021), The impact of COVID-19 on tertiary education in New Zealand: Initial impact on participation, at educationcounts.govt.nz.
35: University of Auckland (2021), Annual Report 2021: Becoming Waipapa Taumata Rau, page 44, at auckland.ac.nz.
