Tertiary education institutions' financial summaries for 2021
The graphs and tables in this section provide a snapshot of how tertiary education institutions (TEIs) performed financially in 2021. They also provide financial and enrolment trend data since 2017.
To get a complete picture of how TEIs are performing, it is important to understand their operating context in 2020, 2021, and 2022 and the impact the Covid-19 pandemic has had on their financial position and enrolments.
We have drawn on our audited financial and enrolment data up to 2021 for Parts 5-8 of this report, and August 2019-2022 enrolment data for this section, which has been provided to us by the Tertiary Education Commission. The Tertiary Education Commission also provided us the non-recovery provision amounts.
In 2020, the Government decided not to recover funding from tertiary education providers that under-delivered courses based on volume, because of the effects of the Covid-19 pandemic. Given the reduced number of domestic and international enrolments in 2020, this provided a "buffer" against a worsening financial position for TEIs.
In its annual report for the year ended 30 June 2022, the Tertiary Education Commission noted that closed borders and continued impacts of the Covid-19 pandemic in 2021 meant that the tertiary education sector experienced reduced demand in 2022. TEIs are experiencing pressure due to reduced enrolments and ongoing waves of illness.
Te Pūkenga
In 2020, almost $57 million was not recovered from Te Pūkenga due to the non-recovery provisions. In August 2022, the number of equivalent full-time students (EFTS) had decreased by more than 17% from August 2021.
Wānanga
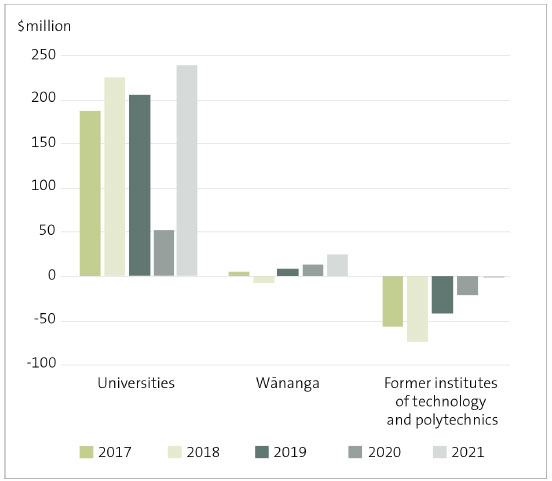
Wānanga ended 2021 and the two previous years in a positive financial position. We also note that Te Wānanga o Raukawa and Te Whare Wānanga o Awanuiārangi received one-off payments from the Government in 2020 and 2021, contributing to their year-end position. These one-off payments were made in recognition of historical underfunding of wānanga research. Between 2019 and 2020, total wānanga enrolments decreased from 22,155 EFTS to 17,840 EFTS. In 2020, $33.8 million was not recovered from wānanga due to the non-recovery provisions.
Universities
Universities were also affected by the Covid-19 pandemic, and a total of $14.8 million was not recovered from universities in 2020 due to the non-recovery provisions. As at August 2022, total enrolments across the universities for the year were 134,235 EFTS compared with 142,760 as at August 2021. The August 2020 and 2019 total EFTS were 138,135 and 138,595 respectively.
As at August 2022, total enrolments across all TEIs was 208,620 EFTS compared with 232,480 EFTS in August 2021. This reflects a more than 10% decrease overall.
Group surpluses and deficits, by type of tertiary education institution, 2017 to 2021

Note: In order to show consistent comparisons across years, the 2020 and 2021 data shown for the former institutes of technology and polytechnics is not from the Te Pūkenga group results, but instead from the annual reports of the former institutes of technology and polytechnics, where available.
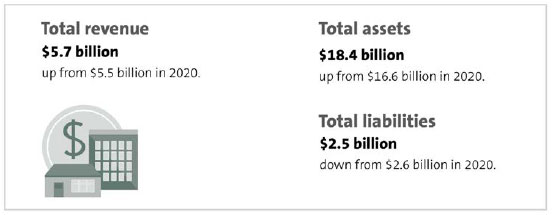
Total revenue, total assets, and total liabilities for 2021

Equivalent Full-time Students and Standard Training Measures1 numbers, 2017 to 2021
Domestic students
| Tertiary Education Institution | 2017 | 2018 | 2019 | 2020 | 2021 |
|---|---|---|---|---|---|
| Universities | 115,930 | 117,100 | 117,550 | 119,355 | 126,895 |
| Wānanga | 24,860 | 23,920 | 22,140 | 17,830 | 21,055 |
| Institutes of technology and polytechnics/Te Pūkenga | 63,275 | 61,235 | 58,075 | 54,976 | EFTS: 66,414 STMs: 21,352 |
| Total | 204,065 | 202,255 | 197,765 | 192,161 | 235,716 |
International students
| Tertiary Education Institution | 2017 | 2018 | 2019 | 2020 | 2021 |
|---|---|---|---|---|---|
| Universities | 17,205 | 18,780 | 21,040 | 18,780 | 15,865 |
| Wānanga | 15 | 15 | 15 | 10 | 5 |
| Institutes of technology and polytechnics/Te Pūkenga | 12,605 | 11,705 | 10,870 | 9,297 | 4,475 |
| Total | 29,825 | 30,500 | 31,925 | 28,087 | 20,345 |
Total students
| 2017 | 2018 | 2019 | 2020 | 2021 | |
|---|---|---|---|---|---|
| Domestic | 204,065 | 202,255 | 197,765 | 192,161 | 235,716 |
| International | 29,825 | 30,500 | 31,925 | 28,087 | 20,345 |
| Total | 233,890 | 232,755 | 229,690 | 220,248 | 256,061 |
1: The term Standard Training Measure refers to learners in work-based learning environments as opposed to learners in provider-based learning environments such as universities and wānanga.
