Part 7: Wānanga financial results and enrolments
Main financial results
7.1
Over the last three years, two of the three wānanga had increased revenue due to one-off payments from the Government.
7.2
Figure 12 shows that Te Whare Wānanga o Awanuiārangi was the only wānanga to have an increase in revenue in 2021. It increased by 36.3%, largely due to a one-off payment of $12 million from the Government in recognition of the historical underfunding of wānanga research. Without this one-off payment, revenue would have declined.36
Figure 12
Revenue for wānanga, from 2019 to 2021
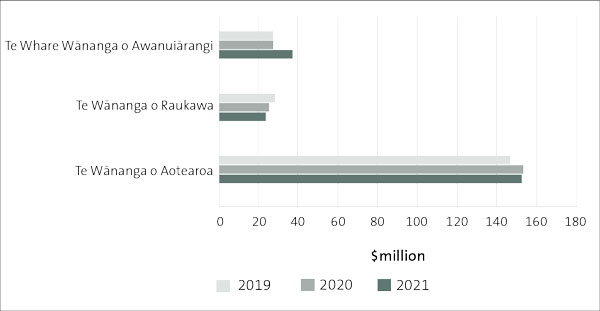
Figure 13
Wānanga surpluses/deficits, from 2019 to 2021
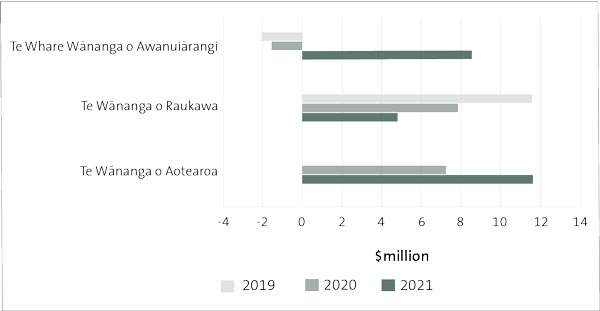
Note: Te Wānanga o Aotearoa had a deficit of $1000 in 2019, so the corresponding bar in the graph above is too small to see.
7.3
Figure 13 shows that all three wānanga recorded surpluses in 2021. The surplus for Te Wānanga o Raukawa reduced by more than 38% between 2020 and 2021. This was mainly due to increased costs for campus development and personnel, and because it received a one-off payment of $5.3 million in 2020, partly in response to the research funding issues highlighted by Te Wānanga o Raukawa in its Waitangi Tribunal Claim.37
7.4
Te Whare Wānanga o Awanuiārangi had a significantly improved financial position, going from a deficit of $1.5 million in 2020 to a surplus of $8.5 million in 2021. However, as mentioned previously, this was due to a one-off payment of $12 million by the Government.
7.5
Te Wānanga o Aotearoa also improved its financial position in 2021, recording a surplus of $11.7 million – an almost 60% increase from the previous year. This was primarily due to a decrease in total expenses such as Covid-19 restrictions affecting the ability to spend as planned.
7.6
The surplus as a percentage of revenue figure for each of the wānanga in 2021 was 7.7% for Te Wānanga o Aotearoa, 20.6% for Te Wānanga o Raukawa, and 23% for Te Whare Wānanga o Awanuiārangi.38 TEC's low-risk threshold is 3%.
7.7
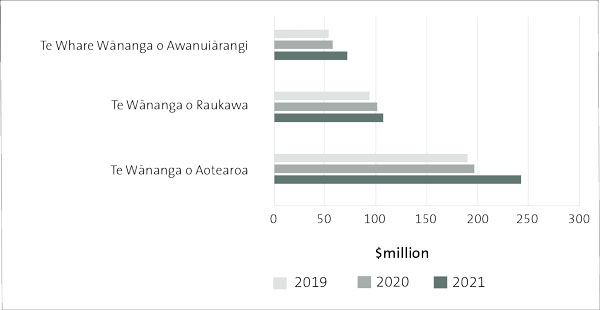
Figure 14 shows that all three wānanga continue to have strong balance sheets, with equity for all three increasing in 2021. The total increase in equity from 2020 to 2021 was 18.1%. All three wānanga had ratios of more than three in 2020 and 2021. This means that they have more than $3 worth of current assets for every $1 of current liabilities.
Figure 14
Wānanga equity, from 2019 to 2021
7.8
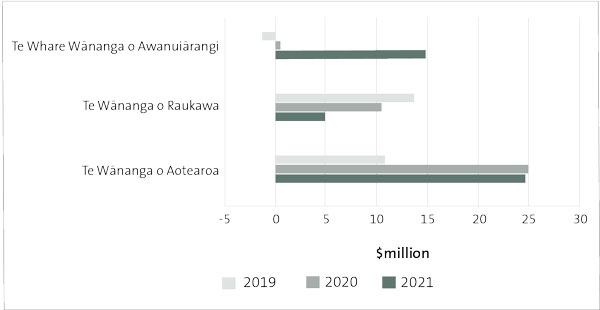
Figure 15 shows that all three wānanga continued to have positive cash flows from their operations in 2021. Te Whare Wānanga o Awanuiārangi had a significant increase in cash flow from operations, from $544,000 in 2020 to $14.9 million in 2021. This was, again, due largely to a one-off payment of $12 million by the Government. Without the one-off payment, the amount in 2021 would have been $2.9 million.
7.9
Te Wānanga o Raukawa's net operating cash flows have been decreasing over the last few years, from $13.6 million in 2019 to $5 million in 2021. The decrease between 2019 and 2020 would have been larger in the absence of the one-off payment explained in paragraph 7.3.
7.10
Te Wānanga o Aotearoa had a significant increase in net cash flows from operations between 2019 and 2020 and then remained fairly consistent in 2021. We understand the increased cash flow in 2020 was largely due to TEC not recovering funding from TEIs as a result of under-delivery in terms of volume during 2020, because of the impacts of Covid-19.
Figure 15
Wānanga cash flows from operations, from 2019 to 2021
7.11
Because wānanga do not have many international students, the border closures did not affect their revenue in 2020 or 2021. However, the Covid-19 pandemic affected enrolments at wānanga in 2020 and 2021 in other ways.
Enrolments
7.12
Wānanga primarily have domestic learners. The number of international full-time learners for all three wānanga is low. In 2019, there were 15 international learners, in 2020 there were 10 international learners, and in 2021 there were five international learners.
7.13
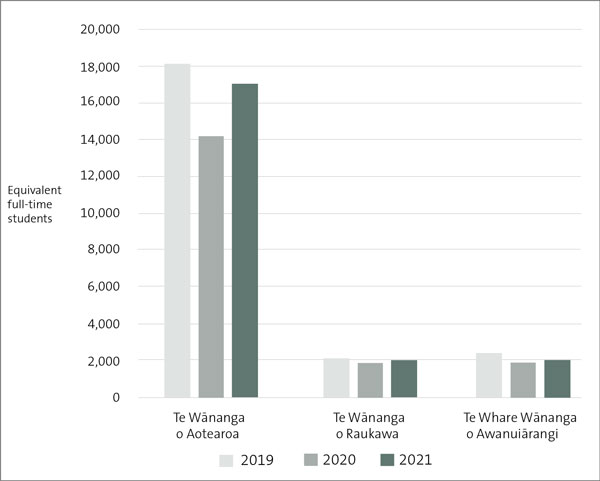
Figure 16 shows the total EFTS at the wānanga from 2019 to 2021. Enrolments at Te Wānanga o Raukawa have increased steadily over the last few years – from 1685 in 2019 to 1995 in 2021. Te Whare Wānanga o Awanuiārangi had 1895 EFTS in 2020 compared to 2385 in 2019. In 2021, total EFTS were 2010.
Figure 16
Total equivalent full-time students at wānanga, from 2019 to 2021
Source: Annual reports of the three wānanga.
7.14
The largest wānanga, Te Wānanga o Aotearoa, had a significant decrease in EFTS in 2020. The number of enrolments in 2020 was nearly 4000 less than in 2019. Enrolment numbers have increased again by nearly 3000 in 2021 to just more than 17,000.
7.15
As at August 2022, Te Wānanga o Raukawa had 2160 EFTS, Te Whare Wānanga o Awanuiārangi had 1705 EFTS, and Te Wānanga o Aotearoa had 13,845 EFTS.
7.16
Students at wānanga are much more likely to be Māori, female, and aged 40 years and over. Because of these demographics, wānanga have a greater proportion of students who are more likely to have competing responsibilities, such as work or looking after children and whānau. Therefore, they were more adversely affected by lockdowns, which resulted in high numbers of course withdrawals.39
Conclusion
7.17
All three wānanga ended 2021 in a positive financial position. However, both Te Wānanga o Raukawa and Te Whare Wānanga o Awanuiārangi received one-off payments from the Government in 2020 and 2021 respectively.
7.18
It will be important for wānanga to reconsider their medium to long-term forecasts and take account of any potential decline in enrolments and any ongoing uncertainty and disruptions to their learning environment.
36: Te Whare Wānanga o Awanuiārangi (2021), 2021 Annual Report, at wananga.ac.nz.
37: Te Wānanga o Raukawa (2021), Te Pūrongo 2021, at wananga.ac.nz. The Waitangi Tribunal Claim number is WAI2698.
38: The 2021 surplus as a percentage of revenue figure for Te Whare Wānanga o Awanuiārangi includes a one-off payment of $12 million.
39: Office of the Auditor-General (2022), Tertiary education institutions: What we saw in 2021, Part 3, paragraphs 3.51-3.55, at oag.parliament.nz.
