figure6.jpg
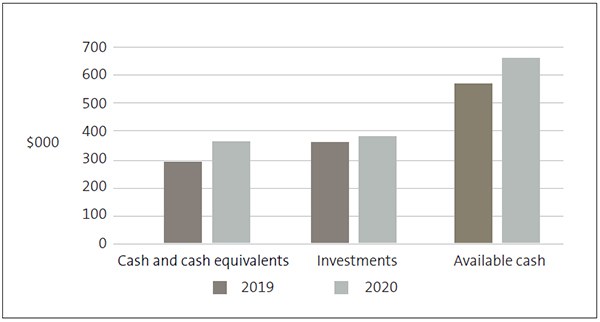
Figure 6. The average levels of cash and investments held by schools increased compared with 31 December 2019. There was also an increase in the average “available cash” for schools, which is calculated as cash and investments held, less any cash held on behalf of third parties.
https://oag.parliament.nz/2021/school-audits/gfx/figure6.jpg/view
https://oag.parliament.nz/2021/school-audits/gfx/figure6.jpg/@@download/image/figure6.jpg
figure6.jpg
Figure 6. The average levels of cash and investments held by schools increased compared with 31 December 2019. There was also an increase in the average “available cash” for schools, which is calculated as cash and investments held, less any cash held on behalf of third parties.


