Part 3: Schools in financial difficulty
3.1
In this Part, we report on the financial health of schools, schools that we consider to be in financial difficulty, and why schools get into financial difficulty.
3.2
The data we provide in this Part is based on financial information collected by the Ministry as at 30 August 2021, unless otherwise stated. At this time, the Ministry’s database had financial information for 2090 schools (85%). For the comparisons of those schools against previous years, we have used the 2019 financial information from the Ministry’s database unless otherwise stated.
The financial health of schools
3.3
Figure 6 summarises the average levels of cash and investments held by schools as at 31 December 2020 and 2019. Cash and cash equivalents are bank accounts and short-term time deposits that are held for 90 days or less. Investments held by schools are typically longer-term deposits. As at 31 December 2020, there had been an increase in average cash ($360,246) and investments ($379,809) held by schools compared to the previous year.
Figure 6
Average cash and investments held by schools as at 31 December 2020 and 2019
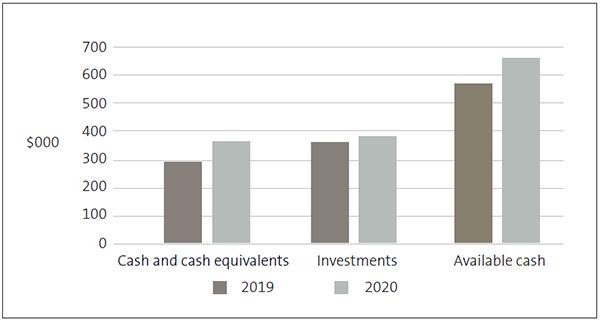
Note: “Available cash” is calculated as cash and investments held, less any cash held on behalf of third parties.
Source: The Ministry of Education’ school financial information database.
3.4
When reviewing a school’s financial position, it is also important to consider a school’s available cash. Schools often hold funds on behalf of third parties, including for capital projects the school is managing for the Ministry, homestay payments for international students, or on behalf of other schools in “cluster”- type arrangements, such as transport networks. “Available cash” is calculated as cash and investments less any cash held for third parties. In 2020, average available cash increased – to $656,217 at 31 December 2020 compared to $568,7007 at 31 December 2019.
3.5
Figure 7 shows that a school’s decile does not affect how much available cash it holds. The number of schools from each decile are fairly evenly spread for each range of available cash.
Figure 7
The numbers of schools that hold different levels of “available” cash as at 31 December 2020, by decile
| Available cash ($000) |
>0 | 0-100 | 101-200 | 201-300 | 301-500 | 501-1,000 | >1,000 |
|---|---|---|---|---|---|---|---|
| Decile 1 | – | 8 | 35 | 27 | 43 | 59 | 41 |
| Decile 2 | – | 14 | 40 | 28 | 43 | 47 | 25 |
| Decile 3 | – | 12 | 42 | 32 | 47 | 49 | 36 |
| Decile 4 | 1 | 19 | 28 | 41 | 42 | 52 | 26 |
| Decile 5 | – | 15 | 44 | 40 | 45 | 46 | 24 |
| Decile 6 | 1 | 24 | 39 | 38 | 38 | 36 | 30 |
| Decile 7 | – | 23 | 43 | 37 | 32 | 41 | 41 |
| Decile 8 | 1 | 24 | 32 | 26 | 41 | 41 | 31 |
| Decile 9 | – | 3 | 39 | 34 | 43 | 55 | 35 |
| Decile 10 | 1 | 17 | 25 | 36 | 44 | 58 | 30 |
| Total | 4 | 159 | 367 | 339 | 418 | 484 | 319 |
Note: Available cash is total cash and investments less any cash held for third parties, such as funds the school holds on behalf of the Ministry for capital works).
Source: The Ministry of Education’ school financial information database.
3.6
As well as cash held for others, cash and investments might be earmarked for a particular purpose, such as a future building project or school trip, or the school might have outstanding bills. Therefore, when we consider whether a school is in financial difficulty, we also consider its working capital position (its available funds less the amounts due in the next 12 months).
3.7
As at 31 December 2020, we identified 43 schools with a working capital deficit. This is a significant reduction on the 85 schools with a deficit in 2019. We discuss working capital deficits further when we discuss schools in financial difficulty.
The effect of Covid-19 on school finances
3.8
In 2020, schools were closed nationwide during the first Level 4 lockdown in March and April – and many remained closed once the country moved to Alert Level 3. However, the Ministry continued to fund schools and provided additional Covid-19-related funding. When completing our 2019 school audits, we concluded that Covid-19 would not adversely affect most schools financially.
3.9
However, we expected that schools that usually raise a lot of their revenue locally through donations, fundraising, and international students would have a more significant reduction in revenue. When the borders closed, some international students were not able to travel to New Zealand and many that had arrived went home early.
3.10
The changes in alert levels also made it difficult for schools to organise and hold many of the activities to raise funds that they usually do. Auckland schools also experienced further lockdowns later in the year.
3.11
These effects were mitigated in part by $20 million of Covid-19 support funding to help schools retain their specialist international education workforce. As well as this, 2020 was the first year of the school donation scheme, meaning that decile 1 to 7 schools that opted into the scheme received additional funding in lieu of donations from parents.
Covid-19-related support and funding
3.12
In response to the Covid-19 pandemic and the associated lockdowns, the Ministry provided schools with additional support and funding during 2020. This included:
- devices and modems to students who did not have ready access to the internet at home;
- additional funding for schools to pay casual school employees and those paid by timesheet, including day relievers, when they were unable to be in the classroom during lockdown, which included paying the wage subsidy for hostel employees;
- additional operational funding to cover Covid-19-related expenses, such as masks and sanitiser, and the additional cleaning required at different alert levels;
- transition funding for schools with international students to meet staff costs and to provide continuity of teaching and pastoral care for those students still in New Zealand; and
- urgent response funding to support learners affected by the Covid-19 lockdowns – which was available for four categories of need:
- attendance;
- well-being to support attendance;
- cultural well-being to support attendance; and
- re-engagement in learning.
3.13
Schools received a total of $57.1 million of Covid-19 support payments in 2020. This included $20 million of international education support funding noted above.8
3.14
Schools also recorded revenue of $19 million for devices for students in their financial statements. The devices are assets of the relevant school that the student attended. About 37,000 devices (laptops, iPads, and Chromebooks) were distributed during the year.9
3.15
The urgent response funding was allocated to schools using the Equity Index to ensure an equitable funding approach. It was also allocated to early learning services. About $26 million was distributed to schools and kura between August and December 2020.10
3.16
Because of the timing of the funding, many schools did not have the opportunity to spend the funds in 2020, which might explain the improvement in some schools’ financial position.
Locally raised funds
3.17
Many schools rely on raising funds locally to provide additional funding. We expected to see an overall reduction in locally raised funds for 2020. This was because Covid-19 lockdowns and related uncertainties made it difficult for schools to carry out their normal fundraising activities. The closed borders also affected international student revenue.
3.18
Total locally raised funds for 2020 was $390 million, compared to $520 million in 2019. Schools also received about $117 million of revenue from international students in 2020. This is a decrease of 26% on 2019 ($157 million).
3.19
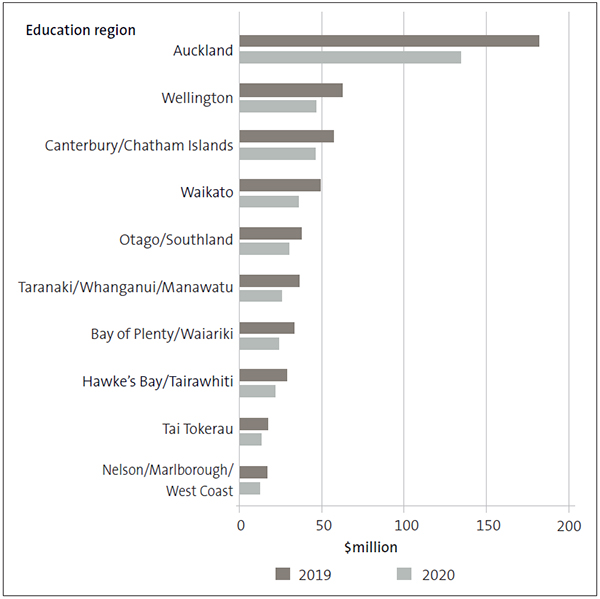
Figure 8 shows that, in 2020, total locally raised funds (excluding international student revenue) reduced for all regions. These funds can be from donations, grants, parent contributions for curriculum recoveries or activities, trading revenue, fundraising, and other revenue, such as rent for school houses and revenue from use of the school hall. In most instances, these types of revenue are discretionary.
Figure 8
Total locally raised funds (excluding international student revenue) for all schools by education region
Source: The Ministry of Education’ school financial information database.
3.20
The donations scheme was introduced in 2020. This gives the schools additional funding of $150 for each student if the school agrees not to ask parents for donations, except for overnight trips such as school camps. For 2020, 92% of eligible decile 1 to 7 schools opted into the scheme and received a total of $64.8 million.11
3.21
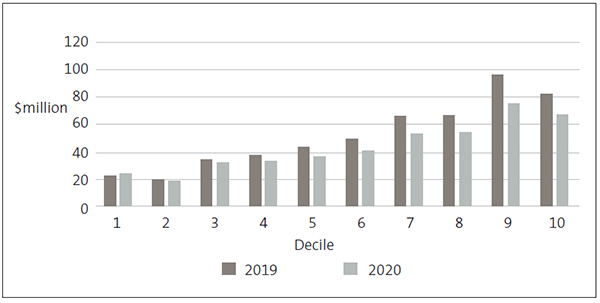
Figure 9 shows that, in total, the additional funding from the donations scheme mitigated against a loss of locally raised funds for schools in decile 1. All other deciles showed an overall reduction with a smaller reduction for lower decile schools, and the gap widening for decile 6 and 7 schools. Decile 8 to 10 schools are not eligible for the funding.
Figure 9
Total locally raised funds plus donations scheme funding for all schools, by decile
Source: The Ministry of Education’ school financial information database and Ministry published listing of schools that have opted into the donations scheme.
International student revenue
3.22
We expected the revenue from international students to reduce when New Zealand closed its borders because of Covid-19. However, many schools retained their international students, and the total revenue schools received from international students reduced by only $40 million (26%).
3.23
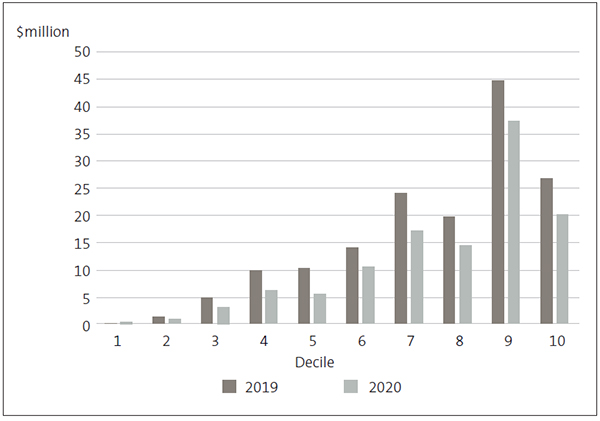
Figure 10 shows the reduction in total international student revenue by decile.
3.24
Schools usually record significant surpluses on international student revenue, because the related expenses are usually small in relation to the fees charged. In 2020, 494 schools reported a total surplus on international students of $56 million. This is an average surplus of $114,000 for each school. This compares with a surplus of $82 million for those schools in 2019. That was an average of $167,000 for each school.
3.25
The impact of Covid-19 on individual schools varied. Of the 476 schools that had international student revenue in both 2019 and 2020, 371 (78%) recorded a reduced surplus from international student revenue. The largest reduction was more than $1 million.
3.26
On the other side, 105 schools that had retained their international students made a higher surplus than the previous year. The highest increase was $707,000. This school had more international students in 2020 than 2019, and reduced expenses compared to the previous year.
Figure 10
Total international student revenue by decile
Source: The Ministry of Education’ school financial information database.
3.27
Some of the reduction in international student revenue was mitigated by Covid-19 support funding for international education of $20 million for those schools with international students. We compared 2020 and 2019, including the Covid-19 international funding paid to schools. Of the 484 schools that received the funding, a quarter increased their total revenue from international students in 2020 compared to 2019.
3.28
The impact of the closed borders on schools in 2020 was not as significant as we expected as many schools retained their international students. For some schools, it was not significant at all. It remains to be seen how the continued border closures will impact schools. The transition funding was only paid in 2020 to help schools to transition to less funding from international students. We will understand this better after we have completed our 2021 audits.
Overall financial results for 2020
3.29
In September 2021, the Ministry reported on the financial performance of schools in its Ngā Kura Aotearoa: New Zealand Schools (2020) report. The Ministry took the reported financial information for 2020 from the financial statements available when it wrote the report (1964 or 82% of schools). It used actual previous-year figures for the remaining schools. As a result, the Ministry’s figures will differ slightly from the figures we have used for our analysis in this report.
3.30
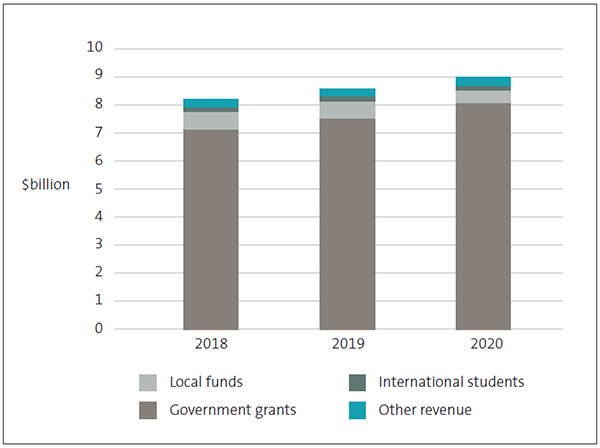
Total school revenue for 2020 showed an increase of 5% on the previous year. Locally raised funds reduced in 2020 compared to previous years (see paragraphs 3.17-3.21), but this was mitigated by an increase in government funding of 7%.
3.31
Figure 11 shows that non-government revenue was relatively consistent in 2018 and 2019. Although there was an increase in government funding between the two years, it was not as significant as for 2020.
Figure 11
Total school revenue for 2020, 2019, and 2018
| 2018 ($billion) |
2018 (%) |
2019 ($billion) |
2019 (%) |
2020 ($billion) |
2020 (%) |
|
|---|---|---|---|---|---|---|
| Other revenue | 0.32 | 3.9 | 0.30 | 3.5 | 0.32 | 3.6 |
| International students |
0.18 | 2.1 | 0.18 | 2.1 | 0.14 | 1.6 |
| Local funds | 0.57 | 6.9 | 0.59 | 6.9 | 0.46 | 5.1 |
| Government grants |
7.14 | 87.1 | 7.50 | 87.5 | 8.07 | 89.7 |
| Total | 8.21 | 100.0 | 8.57 | 100.0 | 8.99 | 100.0 |
Source: Ministry of Education report: 2020 Ngā Kura o Aotearoa.
3.32
As well as the additional Covid-19 support funding and the donations scheme funding, schools received $78.9 million in top-up funding to enable them to meet the agreed pay equity claim for teacher aides and support staff, and $5.5 million was paid to lunch providers on behalf of schools.12 Both these payments were made to address a related increase in school costs.
3.33
Total school expenditure has increased by a lesser amount. It increased by only 3.4% compared to 2019. Figure 12 shows that the biggest increase in spending in recent years is in Learning Resources. This includes teachers’ salaries, teacher aide wages, information and communication technology, staff development, and other curriculum-related expenses.
3.34
This category will include the effects of pay settlements on staff costs for both teachers and teachers’ aides. In 2020, the most significant of these was the pay equity settlement for teacher aides.
Figure 12
Total school expenditure for 2020, 2019, and 2018

| 2018 ($billion) |
2018 (%) |
2019 ($billion) |
2019 (%) |
2020 ($billion) |
2020 (%) |
|
|---|---|---|---|---|---|---|
| Other expenditure | 0.08 | 1.0 | 0.07 | 0.9 | 0.07 | 0.8 |
| International students |
0.08 | 1.0 | 0.09 | 1.0 | 0.07 | 0.8 |
| Depreciation | 0.23 | 2.9 | 0.24 | 2.8 | 0.24 | 2.7 |
| Local funds | 0.28 | 3.4 | 0.29 | 3.4 | 0.22 | 2.5 |
| Property | 2.03 | 25.0 | 2.09 | 24.6 | 2.16 | 24.6 |
| Administration | 0.46 | 5.6 | 0.48 | 5.7 | 0.48 | 5.5 |
| Learning resources |
4.98 | 61.1 | 5.24 | 61.6 | 5.55 | 63.1 |
| Total | 8.14 | 100.0 | 8.50 | 100.0 | 8.79 | 100.0 |
Source: Ministry of Education report: 2020 Ngā Kura o Aotearoa.
3.35
Overall, schools reported a surplus of about $198 million for 2020. This compares with an overall surplus of about $70 million in earlier years. For the 2090 schools that we have data for, we have compared the number of schools that recorded a surplus and deficit with the previous year. We found that 80% recorded a surplus in 2020, compared to only 59% for 2019.
3.36
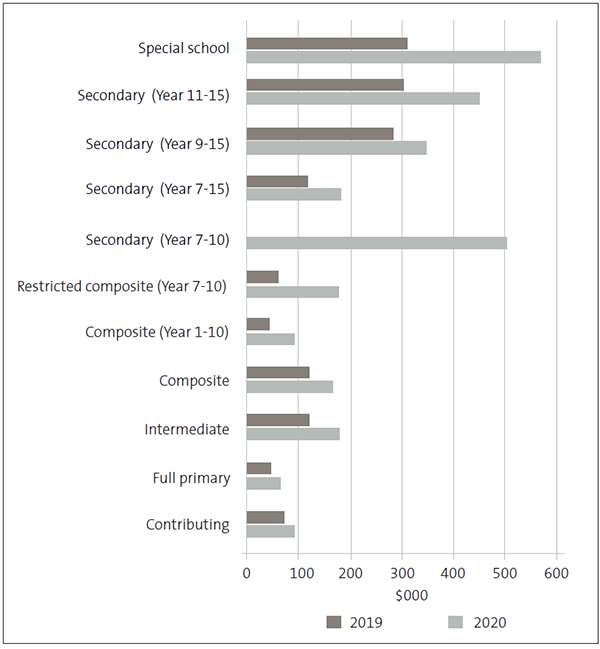
Figure 13 shows that the average surplus for all types of schools was also higher in 2020.
3.37
This information supports our earlier findings about the overall improvement in the financial position of schools despite Covid-19. However, this has been achieved through additional Covid-19 government support.
Figure 13
Average surplus recorded in 2020 by school type compared to 2019
Source: The Ministry of Education’ school financial information database.
What we mean by financial difficulty
3.38
Most schools are financially sound. However, each year we identify some schools that we consider could be in financial difficulty.
3.39
When we issue our audit report, we are required to consider whether the school can continue as a “going concern”. This means that the school has enough resources to continue to pay its bills for at least the next 12 months from the date of the audit report.
3.40
When carrying out our “going concern” assessment, we look for indicators of financial difficulty. One such indicator is when a school has a “working capital deficit”. This means that, at that point in time, the school needs to pay out more funds in the next 12 months than it has available. Although a school will receive further funding in that period, it might find it difficult to pay bills as they fall due, depending on the timing of that funding.
3.41
A school that goes into overdraft or has low levels of available cash is another sign of potential financial difficulty. Because we are considering the 12 months after the audit report is signed, we will also consider the school’s performance and any relevant matters in the period since the year-end.
3.42
In considering the seriousness of the financial difficulty, we usually look at the size of a school’s working capital deficit against its operations grant. Although many schools receive additional revenue, this is often through donations, fundraising, or other locally sourced revenue, so it is discretionary. For most schools, the operations grant is their only guaranteed source of income.
3.43
Of the 43 schools with a working capital deficit this year:
- 29 (2019: 53) schools had a working capital deficit of between 0% and 10% of the operations grant;
- 10 (2019: 20) schools had a working capital deficit of between 10% and 20% of the operations grant; and
- 4 (2019: 12) schools had a working capital deficit of more than 20% of the operations grant.
3.44
Figure 14 shows that decile rating does not affect whether schools have a working capital deficit. It also shows that the number of schools with a deficit has significantly reduced and that the two previous years are relatively similar.
Figure 14
Schools with working capital deficits, by decile
| Decile | 2020 | 2019 | 2018 |
|---|---|---|---|
| Decile 1 | 2 | 9 | 9 |
| Decile 2 | 3 | 10 | 14 |
| Decile 3 | 7 | 9 | 10 |
| Decile 4 | 4 | 4 | 5 |
| Decile 5 | 2 | 6 | 11 |
| Decile 6 | 8 | 11 | 9 |
| Decile 7 | 6 | 9 | 4 |
| Decile 8 | 4 | 12 | 9 |
| Decile 9 | 3 | 5 | 8 |
| Decile 10 | 4 | 10 | 9 |
| Total | 43 | 85 | 88 |
Source: The Ministry of Education’s school financial information database for 2020. Previous year figures are those reported in the Office of the Auditor-General’s Results of the 2019 school audits.
3.45
Of the four schools with a working capital deficit greater than 20% of its operations grant (which we consider to be serious financial difficulty), two are decile 10 schools, one is decile 3, and one is decile 4.
Schools considered to be in serious financial difficulty
3.46
Not all schools with a working capital deficit at the balance date are in financial difficulty. When making this assessment, our auditors will consider other factors, including the school’s financial performance since the year-end.
3.47
When we have assessed that a school is in financial difficulty, we ask the Ministry whether it will continue to support the school. If the Ministry confirms that it will continue to support the school, the school can complete its financial statements as a “going concern”.
3.48
This means that the school is expected to be able to continue to operate and meet its financial obligations in the near future. If we consider a school’s financial difficulty to be serious, we draw attention to this in the school’s audit report.
3.49
Figure 15 shows the 17 schools that obtained letters confirming the Ministry’s support and as a result could complete their 2020 financial statements on a “going concern” basis. This is a significant reduction from previous years, when about 35-40 schools needed letters of support (2019: 38 schools).
3.50
We referred to serious financial difficulties in 11 of these 17 schools’ audit reports.
Figure 15
Schools that needed letters of support for their 2020 audits to confirm they were a “going concern”
| School | 2020 | 2019 | 2018 and earlier years |
|---|---|---|---|
| Albany Junior High School | |||
| Bathgate Park School | |||
| Burnside Primary School | |||
| Cambridge East School | |||
| Kadimah School | |||
| Kavanagh College | – | ||
| Kokopu School | – | – | |
| Mana College | – | ||
| Mercury Bay Area School | – | ||
| Nelson College | |||
| Ngakonui Valley School | – | – | |
| Ravensbourne School | – | – | |
| Saint Joseph’s School (Grey Lynn) | – | ||
| Saint Joseph’s School (Hawera) | – | – | |
| Tauhara Primary School | – | ||
| Taumuranui High Schoo | – | ||
| Waitara Central School | – | ||
| Total | 17 | 13 | 6 |
Source: Information taken from school financial statements and the Office of the Auditor-General’s audit reports.
3.51
We also identified that the following schools needed letters of support from the Ministry for previous-year audits that were completed since we last reported:
- Saint Joseph’s School (Grey Lynn) (2019);
- Taumuranui High School (2019);
- Te Kura o Pakipaki (2015 and 2016);
- Westminster Christian School (2019); and
- Te Kura Kaupapa Māori o Te Puaha o Waikato (2019).
3.52
The number of schools in financial difficulty usually remains about the same each year at about 40 schools. However, many of the schools we identified as being in financial difficulty last year have now improved their financial position. They have done this either by reducing their working capital deficit enough that they no longer need a letter of support or by bringing their working capital position into surplus.
3.53
Of the 38 schools we identified in our report last year, only 10 needed a letter of support again this year. Six of these have needed a letter of support for the past three years or more. We consider that 26 of the 38 schools are no longer in financial difficulty. The audits of the remaining two schools have not yet been completed.
3.54
We expected to identify significantly more schools in financial difficulty because of the effects of Covid-19. This was not the case. However, as well as the above schools where a letter of support was necessary, our auditors did raise concerns about potential financial difficulties in 44 further schools. This was usually because of continued deficits that are eroding the working capital and/or continued deficit budgeting.
Why do schools get into financial difficulty?
3.55
Last year, we reported on the reasons why schools get into financial difficulty. This is usually because there is an unexpected drop in funding or because schools are not adequately budgeting and/or monitoring their finances. For most schools, it can be difficult to suddenly reduce spending if they do not receive the funds that they are expecting. This is particularly the case when the funding is used for staffing or other spending that the school is already committed to.
3.56
The most common reasons for schools getting into financial difficulty are:
- schools relying on locally raised funds to fund operational costs, including from international student revenue; and
- schools not adequately monitoring their staffing levels.
3.57
Not adequately monitoring staffing levels can result in schools overusing their Ministry staff entitlement. They then have to refund the overspend back to the Ministry or fund the extra staff directly. Either can result in a reduction in the operational funding the school has to spend on other things.
3.58
We have discussed levels of locally raised funds in paragraphs 3.17-3.21. We concluded that, although levels have dropped, the donations scheme and Covid-19 support funding have mitigated this for many schools. We discuss staffing levels below.
Staffing levels
3.59
Each school is given an entitlement of teachers that the Ministry will fund. The entitlement is based on the size of the school roll. A school must fund any teachers that are additional to its entitlement, either by paying the additional teachers directly from its own funds or refunding to the Ministry any overuse of its entitlement of Ministry-funded teachers after the year end.
3.60
All schools pay non-teaching staff from their operations grant. Schools can also choose to use their operations grant and other funding for additional teachers. If a school uses a large percentage of its operations grant to pay staff, it will need other sources of funding to meet its other operational costs.
3.61
When schools are unable to generate the revenue they anticipated from other sources, they might have to spend cash reserves. If no other source is available, they might find themselves in financial difficulty.
3.62
As Figure 16 shows, when we calculated the board funded staff costs as a percentage of each school’s operations grant for 2020, we found that the results were consistent with what we found in 2019. Because schools would have already set their staffing levels for 2020 before the pandemic happened, this was expected.
Figure 16
Staff costs that are board-funded as a percentage of the school’s operations grants
| Year | 0-19% | 20-39% | 40-59% | 60-79% | 80-99% | 100% + | Total number of schools |
|---|---|---|---|---|---|---|---|
| 2020 | 17 | 126 | 648 | 855 | 319 | 125 | 2090 |
| 2019 | 18 | 141 | 621 | 783 | 312 | 145 | 2020* |
* Number of schools entered into the Ministry’s database of schools’ financial statements, as at October 2020.
Note: The table shows the number of schools in each of six different categories for the percentage of their operations grant used to fund staffing costs.
Source: The Ministry of Education’s financial information database for 2020. Previous year figures are those reported in the Office of the Auditor-General’s Results of the 2019 school audits.
3.63
About half of the 125 schools that use the equivalent of more than 100% of their operations grant to pay staff have international students.
3.64
Of the twenty-three schools funding salaries equivalent to more than 150% of their operations grant, more than half are special education schools, which receive additional funding for staff. Of the remaining 10 schools, eight are state-integrated schools that often get additional support for staffing from their proprietor.
3.65
In 2020, the Ministry provided additional support to schools, including making emergency payments directly to relieving staff. However, if schools continue to see a reduction in revenue from local sources, they should adjust staffing levels accordingly to help prevent them getting into financial difficulty.
Conclusion
3.66
Overall, we can see that the international student transition funding, the donations scheme funding for decile 1 to 7 schools, and other Covid-19 support funding mitigated some of the expected reduction in revenue from locally raised funds (including from international revenue) because of Covid-19.
3.67
Although spending increased in 2020, mainly in terms of staffing, additional payments from the Ministry supported some of this spending. This explains why the overall financial position of schools has improved. However, it was also clear from our analysis that the impact on individual schools is varied.
3.68
Although our auditors identified only 17 schools that we consider to be in financial difficulty and another 44 schools that had the potential to get into financial difficulty, our analysis showed that many schools continue to spend large amounts of their funding on staff. Without the same level of Covid-19 support funding as in 2020, there is a risk that more schools get into financial difficulty in 2021.
7: Office of the Auditor-General (2019), Results of the 2019 school audits.
8: Ministry of Education report: 2020 Ngā Kura o Aotearoa.
9: Ministry of Education report: 2020 Ngā Kura o Aotearoa.
10: Ministry of Education report: 2020 Ngā Kura o Aotearoa.
11: Ministry of Education report: 2020 Ngā Kura o Aotearoa.
12: These amounts are included in the government grants that schools received.

