Concise, relevant, and understandable performance reporting
Our general observations
From the 40 annual reports we looked at, most had too much detailed information. This often obscured or distracted users from more meaningful reporting.
We liked annual reports that were concise yet covered all significant aspects of performance and functions and operations.
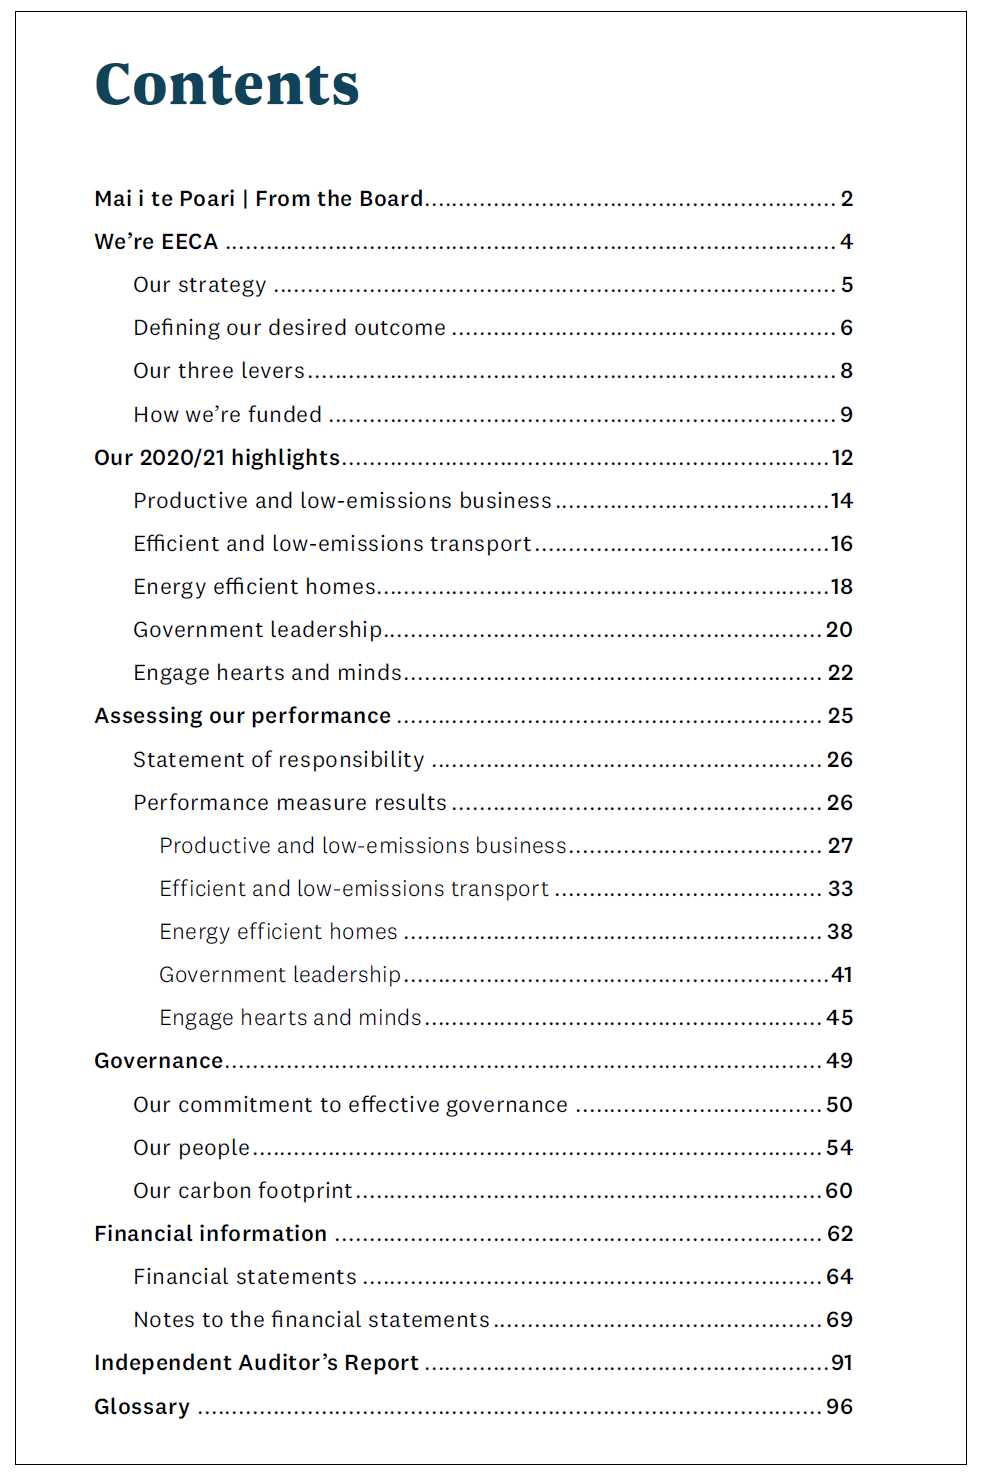
Energy Efficiency and Conservation Authority
Energy Efficiency and Conservation Authority’s 2020/21 Annual Report strikes a good balance between reporting on what is important to its performance and users and being concise so the user isn’t overwhelmed with information.
What we liked:
- Concise reporting on performance that does not overwhelm users with information.
- Reporting focused on what is important to its business model and users.
- Structured around strategic focus areas, with underlying outcomes, that are relevant to users and its role and purpose.
- Plain language, clear structure, and a logical flow that is easy to follow and understandable to users.
- Consistent reporting on questions that matter to users under each outcome area (“why x”, “the outcomes we seek”, “key achievements”), with reporting on relevant measures at the outcome and service-levels.

New Zealand Customs Service
New Zealand Customs Service's 2020/21 Annual Report provides a well-structured and relevant account of how it performed, including what went well and didn’t, with multiple layers of reporting. This makes it easier for users to understand how well it performed. It is particularly challenging for large and complex public organisations to provide a report that is both concise and appropriately covers the public organisation's performance.
What we liked:
- Reporting covers all key aspects of performance.
- Plain language and clear logical flow that makes the annual report easy to follow.
- Simple overviews of performance with meaningful performance information on impacts, initiatives, and services under each priority area.
- Link to relevant and detailed reporting at a later point.
- Reporting covers what went well and what didn’t (see pages 13 and 19 of the annual report).
- Uses past performance to look ahead and plan to improve performance.

Inland Revenue Department
Inland Revenue Department’s 2020/21 Annual Report presents a relevant and understandable account of how well it is serving its customers.
What we liked:
- Reporting covers all key aspects of performance.
- Clear connections between the financial and non-financial reporting with a focus on cost effectiveness:
We’re seeing a range of efficiencies from our new systems and more automated processes. For example, the cost of processing employment information and income and GST returns has fallen significantly. It cost $1.86 compared to $2.78 in 2019-20.
Overall we’re doing more with less. Our total spend excluding transformation was $50 million less than 2016-2017 (see page 44 of the annual report).
- Reporting has clear focus on people who use its services.
- Graphs clearly show reporting on "key results” and trends, enabling a good overview of performance.
- Reporting tells a clear story on how changes and transformation to its business model have affected and improved its performance and how well it serves its customers.
- Comprehensive set of measures.


