Appendix 5: Trends in workforce numbers and complaints

Our insights into five health regulatory authorities.

Total registered workforce, 2018/19 to 2022/23
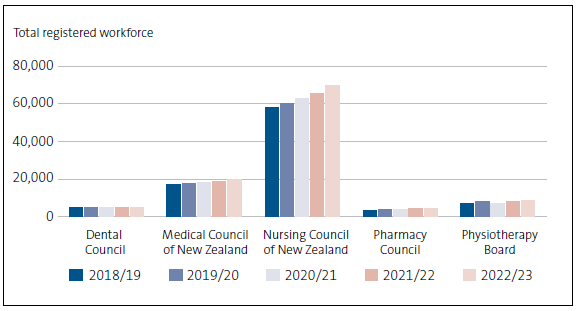
The Figure is a bar chart with sets of data for the Dental Council, Medical Council, Nursing Council, Pharmacy Council, and Physiotherapy Board. The workforce numbers for the Dental Council have remained static, increased slightly over the five years for the Medical Council, Pharmacy Council, and Physiotherapy Board, and increased more noticeably year on year for the Nursing Council (from less than 60,000 in 2018/19 to nearly 70,000 in 2022/23).

Total number of complaints and notifications received, 2018/19 to 2022/23
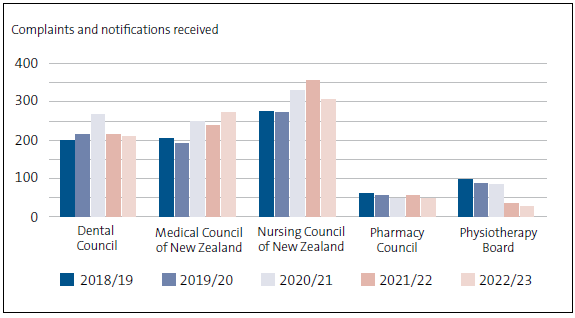
The Figure is a bar chart with sets of data for the Dental Council, Medical Council, Nursing Council, Pharmacy Council, and Physiotherapy Board. The Dental Council received about 200 complaints and notifications for most years but had a peak of about 260 in 2020/21. The Medical Council's numbers have increased from about 200 to about 260. The Nursing Council figures fluctuate above 250 and around 300, and peaked at more than 350 in 2021/22. The Pharmacy Council had far fewer - about 50 each year. The Physiotherapy Board has seen a steady decline, from just under 100 to about 40 in 2022/23.

Proportion of complaints and notifications for each registered workforce, 2018/19 to 2022/23
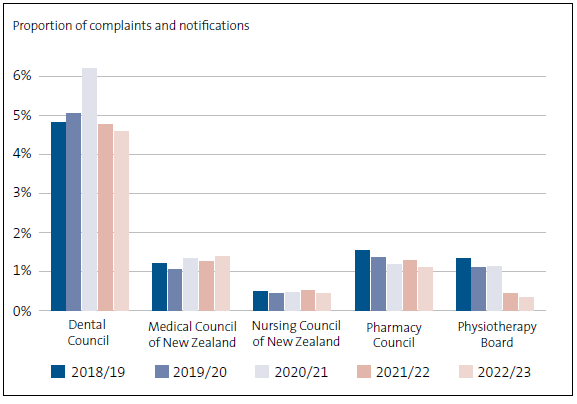
The Figure is a bar chart with sets of data for the Dental Council, Medical Council, Nursing Council, Pharmacy Council, and Physiotherapy Board. It shows complaints and notifications as a percentage of the workforce for each of five years. The percentages are noticeably higher for the Dental Council but usually under 5% (there was a spike to just over 6% in 2020/21). The other Councils and Board receive complaints and notifications that represent less than 0.5% to about 1.5% of their workforces.