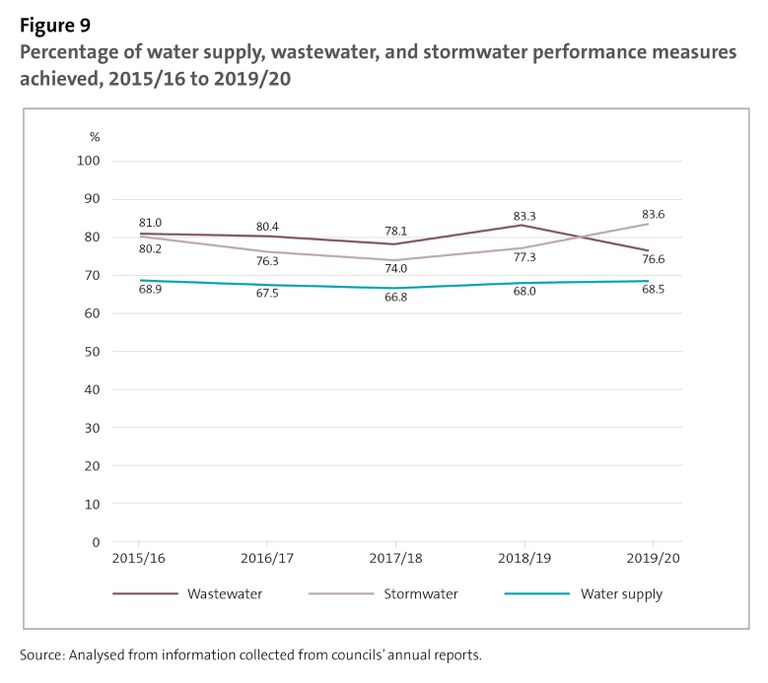
Figure 9 - Percentage of water supply, wastewater, and stormwater performance measures achieved, 2015/16 to 2019/20
This figure shows a line graph with percentage points on the y-axis and financial years on the x-axis. There are three lines on the graph. One line represents the percentage of water supply measures achieved, which has remained constant over the five-year period from 2015/16 to 2019/20, with the lowest point being 66.8% in 2017/18 and the highest 68.9% in 2015/16. The other two lines represent wastewater measures and stormwater measures achieved. Both remained relatively constant between 2015/16 and 2018/19. However, between 2018/19 and 2019/20, the percentage of achieved wastewater measures declined from 83.3% to 76.6% and the percentage of achieved stormwater measures increased from 77.3% to 83.6%.
https://oag.parliament.nz/2021/local-govt/media-kit/figure9.jpg/view
https://oag.parliament.nz/2021/local-govt/media-kit/figure9.jpg/@@download/image/figure9.jpg
Figure 9 - Percentage of water supply, wastewater, and stormwater performance measures achieved, 2015/16 to 2019/20
This figure shows a line graph with percentage points on the y-axis and financial years on the x-axis. There are three lines on the graph. One line represents the percentage of water supply measures achieved, which has remained constant over the five-year period from 2015/16 to 2019/20, with the lowest point being 66.8% in 2017/18 and the highest 68.9% in 2015/16. The other two lines represent wastewater measures and stormwater measures achieved. Both remained relatively constant between 2015/16 and 2018/19. However, between 2018/19 and 2019/20, the percentage of achieved wastewater measures declined from 83.3% to 76.6% and the percentage of achieved stormwater measures increased from 77.3% to 83.6%.


