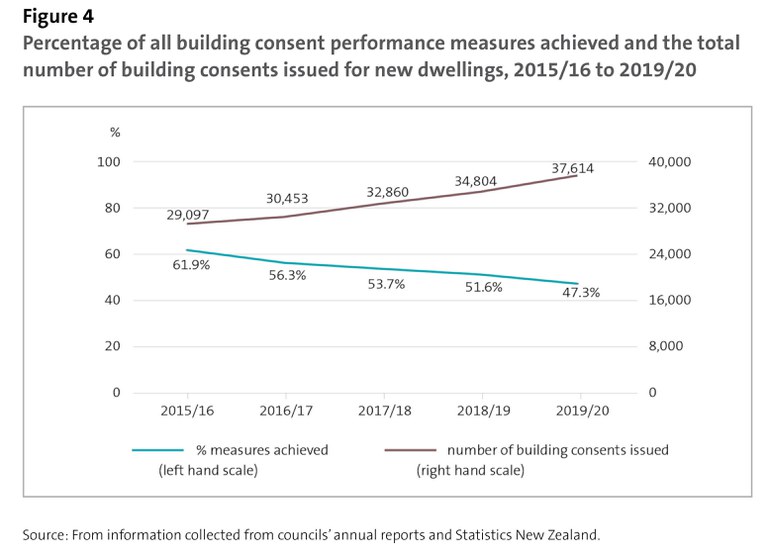
Figure 4 - Percentage of all building consent performance measures achieved and the total number of building consents issued for new dwellings, 2015/16 to 2019/20
This figure shows a line graph with percentage points on the left y-axis and numbers of consents on the right axis. The x-axis tracks financial years. The graph shows a steady decline from 61.9% performance measures achieved in 2015/16 to 47.3% achieved in 2019/20. The graph also shows a steady increase in the number of building consents issued, from twenty-nine thousand and ninety-seven in 2015/16 to thirty-seven thousand six hundred and fourteen in 2019/20
https://oag.parliament.nz/2021/local-govt/media-kit/figure4.jpg/view
https://oag.parliament.nz/2021/local-govt/media-kit/figure4.jpg/@@download/image/figure4.jpg
Figure 4 - Percentage of all building consent performance measures achieved and the total number of building consents issued for new dwellings, 2015/16 to 2019/20
This figure shows a line graph with percentage points on the left y-axis and numbers of consents on the right axis. The x-axis tracks financial years. The graph shows a steady decline from 61.9% performance measures achieved in 2015/16 to 47.3% achieved in 2019/20. The graph also shows a steady increase in the number of building consents issued, from twenty-nine thousand and ninety-seven in 2015/16 to thirty-seven thousand six hundred and fourteen in 2019/20


