Our performance
Our purpose
Our purpose is to improve trust and promote value in the public sector. We do this by influencing improvements in public sector performance and accountability. We aim for our work to be relevant, make a positive difference to the way the public sector operates, and help Parliament and New Zealanders to have trust and confidence in public organisations.
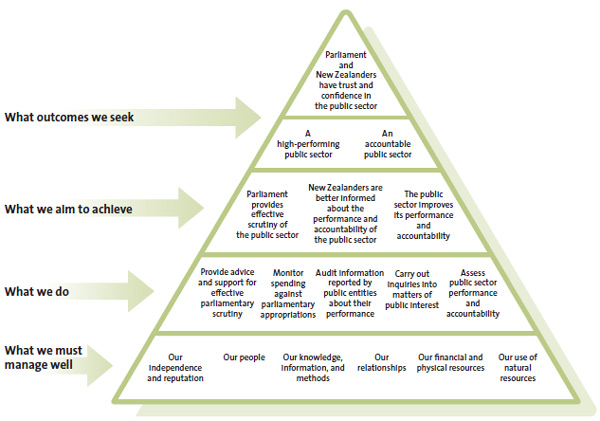
The ultimate outcome we seek is that Parliament and New Zealanders have trust and confidence in the public sector. For this to happen, the public sector needs to perform well and provide reliable, meaningful, and timely information so that public organisations can be held to account for their spending and performance.
Our performance framework
Everything we do is directed towards achieving the outcomes in our performance framework. The framework sets out the outcomes we contribute to, impacts we are aiming to achieve, and work we do (our services).
Each of our outcomes, impacts, and services have performance indicators (or measures) and annual targets. The performance indicators for our services are based on quantity, quality, timeliness, or a combination of these.
The data and commentaries in the following sections describe the results for each of our performance indicators for 2023/24.

The outcomes we seek
Trust and confidence are at the heart of everything we do. To maintain trust and confidence, it is important that public organisations continue to improve how they account for the public resources they use, meet the high standards of governance and integrity expected of them, and continue to improve their performance.
| What went well | What didn't go to plan |
|---|---|
| Results from the Kiwis Count survey shows that experience-based trust in public services remains high. New Zealand remains one of the top-performing countries in the Transparency International Corruption Perceptions Index. We completed most audits of large public organisations on time. |
New Zealand's ranking in the Transparency International Corruption Perceptions Index dropped from second to third place. The timeliness of audits of schools and smaller public organisations remains a challenge. |
Outcome 1: Parliament and New Zealanders have trust and confidence in the public sector
New Zealand does well when compared globally on measures of trust. For example, the OECD's 2023 survey on trust in public institutions (published in 2024) found that general trust in government was 46% in New Zealand, compared to the OECD average of 39%, and that satisfaction with administrative services was 70% in New Zealand, compared to the OECD average of 66%.4 The survey also observed a lower level of trust among women than among men; at 18%, this gap was greater than the 7% OECD average gender gap in trust.
The OECD's survey results also highlight that satisfaction with services provided by public institutions tends to be rated higher than general trust, both in New Zealand and in the OECD. This pattern suggests that the underlying quality of services provided by public organisations does make a difference to trust.
The Kiwis Count survey results are similar to those of the OECD survey of trust in public institutions, showing a higher level of reported trust when people think about the interactions they have had with public organisations (experience-based trust) than when they think about government in more general terms (perception-based trust).
The 2023/24 survey shows that New Zealanders' level of experience-based trust has remained relatively stable since 2020/21. However, perception-based trust has declined to its lowest since pre-Covid times.
Our indicators use the overall results of the Kiwis Count survey. However, levels of trust in public services vary between communities. Māori, Pacific, and disabled respondents tend to have lower trust levels than other groups, while Asian respondents tend to have higher trust levels than other groups.5
The Transparency International Corruption Perceptions Index ranks 180 countries and territories by their perceived levels of public sector corruption. In 2023, New Zealand scored its lowest score since the index was established in 1995, at 85, and dropped in global ranking from second to third. Transparency International's reporting on New Zealand attributed this drop to reduced business leader confidence in government integrity systems. However, New Zealand's ranking at third of 180 countries remains an indicator of strong transparency.
Indicator: Levels of trust in public services based on Kiwis Count survey
| Measure | 2023/24 | Change | 2022/23 | 2021/22 | 2020/21 | 2019/20 |
|---|---|---|---|---|---|---|
| Experience-based trust | 80% | -2% | 82% | 81% | 81% | 79% |
| Perception-based trust | 56% | -2% | 58% | 62% | 69% | 49% |
| Target: Improving trend, or at least maintained | Not achieved | |||||
| Source: Te Kawa Mataaho Public Service Commission. In our 2022/23 Annual Report, we reported the Quarter 3 data for experience-based trust and perception-based trust results of the Kiwis Count survey. The 2022/23 results in this report have been updated to provide the Quarter 4 data for that year. |
||||||
Indicator: Transparency International Corruption Perception score
| Measure | 2023/24 | Change | 2022/23 | 2021/22 | 2020/21 | 2019/20 |
|---|---|---|---|---|---|---|
| Transparency International Corruption Perception score | 85 (3rd place) | -2 (-1 place) | 87 (2nd equal) | 88 (1st equal) | 88 (1st equal) | 87 (1st equal) |
| Target: Improving trend, or at least maintained | Not achieved | |||||
| Source: "CPI 2023: Highlights and Insights" at transparency.org. | ||||||
Outcome 2: A high-performing public sector
We have not reported an indicator for this outcome since the quality of public services measure was removed from the Public Service Commission's Kiwis Count survey methodology.
In 2023/24, we worked on an alternative indicator of overall public sector performance, focusing on aggregate analysis of performance measurement across public organisations. That work shows that the public organisations regularly scrutinised by Parliament achieved 55% of their performance targets, while councils achieved 64% of their performance targets. For public organisations scrutinised by Parliament, this was 12% higher than the average result for the previous four years. For councils, this aggregate level of performance has been relatively consistent since 2020/21.
Our analysis gave us some insight into patterns of performance but it also highlighted our publicly stated concern that the reporting of individual public organisations does not always meet our expectations for meaningfulness and relevance.
We were not confident that aggregating this reporting results in a meaningful and relevant assessment of the overall performance of public organisations in New Zealand. We were also unable to draw firm conclusions about how well services are meeting the needs of different communities, because this is not systematically reported. For these reasons we did not establish a new indicator based on this information in 2023/24. We will continue to explore options for a suitable indicator in 2024/25.
Outcome 3: An accountable public sector
For Parliament and New Zealanders to have trust and confidence in the public sector, public organisations need to be effectively held to account for their spending and performance. This means timely and reliable information about their spending and performance must be available.
We assess how reliable reported information is based on the percentage of unmodified audit opinions from our annual audits. That percentage remains high at 96%, indicating that overall, public organisations are providing reliable information (noting that we consider there remains room for improvement in the meaningfulness and relevance of non-financial performance reporting).
We assess how timely the reporting of financial and non-financial performance information is by examining the extent to which we have been able to complete our annual audits in keeping with statutory deadlines. Timeliness has been lower than target since the onset of Covid-19. We are gradually improving completion rates but are not yet back to pre-Covid timeliness. The reasons for this are discussed in more detail under our results for Service 3: Audit information reported by public organisations about their performance.
Although the overall timeliness of audited information is lower than it should be, audited information is available on time for most large organisations. In addition, the audited financial statements of the government, an essential document contributing to overall accountability, was published in a timely manner. Some audits were late but still completed before the end of the financial year, ensuring that reliable information about public organisations is available.
Indicator: Number and percentage of unmodified audit opinions from our annual audits
| Measure | 2023/24 | Change | 2022/23 | 2021/22 | 2020/21 | 2019/20 |
|---|---|---|---|---|---|---|
| Number and percentage of unmodified audit opinions from our annual audits | 3018 (96%) | +42 (-1%) | 2976 (97%) | 2595 (96%) | 3356 (97%) | 2836 (97%) |
| Target: Improving trend, or at least maintained | Not achieved |
Indicator: Percentage of audit reports that are signed by the applicable statutory deadline
| Measure | 2023/24 | Change | 2022/23 | 2021/22 | 2020/21 | 2019/20 |
|---|---|---|---|---|---|---|
| Percentage of audit reports that are signed by the applicable statutory deadline | 59% | +4% | 55% | 57% | 71% | 63% |
| Target: At least 80% | Not achieved |
Indicator: Number of public entities with audit reports in arrears, as at 30 June 2024
| Measure | 2023/24 | Change | 2022/23 | 2021/22 | 2020/21 | 2019/20 |
|---|---|---|---|---|---|---|
| Number of public entities with audit reports in arrears, as at 30 June 2024 | 938 | -151 | 1089 | 1078 | 600 | 848 |
| Target: Fewer than 495 | Not achieved | |||||
| "In arrears" means not completed within statutory timeframes and remaining outstanding as at 30 June 2024. This measure has been changed from "decreasing" to "fewer than 495". This figure represents about 15% of the organisations we audit each year and is a more accurate reflection of the performance we want to achieve for this measure. It also takes into account the high volume of school audit reports with a statutory deadline at the end of May. |
||||||
4: See “OECD Survey on Drivers of Trust in Public Institutions 2024 Results - Country Notes: New Zealand” at oecd.org.
5: See “Kiwis Count” at publicservice.govt.nz.

