Part 3: Meaningful performance measures and reporting
A long-term plan should provide a clear basis for assessing a council’s performance. The service performance information in a council’s annual report should allow communities to effectively assess the council’s performance and hold it to account.
An effective long-term plan should include a performance reporting framework that describes to communities:
- what the council intends to achieve;
- the services the council intends to deliver; and
- how performance will be assessed.
The performance reporting framework should reflect the council’s intended direction, both overall and for each group of activities. It should provide clarity about what the council plans to achieve in the short term and an indication of its plans and performance in the longer term.
The performance reporting framework is the main mechanism for the council to inform its community about:
- the range, quality, quantity, timeliness, and effect of the services it intends to provide; and
- the choices made by the local authority for its services.
A well-designed, cohesive performance reporting framework will clearly reflect the links between the following elements (right).
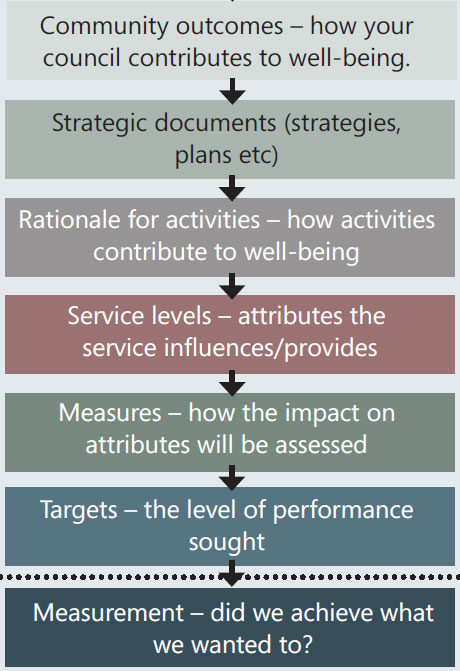
Source: Taituarā | SOLGM (2020) Your Side of the deal 2021: Performance Management in the Long Term Plan.
The framework should include comprehensive, meaningful, and appropriate measures that provide an adequate basis for reporting on the council’s performance in the annual report and for determining whether a level of service has been delivered.
Accordingly, when selecting measures, councils should consider:
- the aspects of service and performance that are most important to the community;
- whether the measures are relevant, understandable, and verifiable;
- whether the measures and targets will enable readers to assess the effectiveness of a council’s main policy and investment decisions;
- whether the measures and targets reflect the financial significance of the activity; and
- the most important dimensions of performance in delivering services, such as quantity, responsiveness, quality, reliability, timeliness, and accessibility.
Although most councils’ performance measures relate to service delivery and core services, their broader service performance objectives should also be clear for each group of activities. These objectives may be encompassed in the rationale statement for a group of activities, the levels of service statements, or other narrative on the group of activities. It will often be appropriate to have achievement (or impact) measures in relation to those broader objectives to assess how the council is promoting improved well-being outcomes for the community (as well as the measures of service delivery).
The annual report must provide an honest account of how the council performed during the year. It should provide meaningful and relevant information that allows readers to understand how well the council has performed against its planned levels of service.
Examples of good practice
Our good practice examples draw on both 2021-2031 long-term plans and 2021/22 annual reports.
We have categorised the examples under four themes:
- appropriate and meaningful mix of measures;
- balanced reporting on what went well and what didn’t go well;
- comparability; and
- commentary and analysis.
What to aim for and what to avoid
| What to aim for: |
|---|
| Measures Starting the process of developing the performance reporting framework for the new long-term plan by first performing a structured review of the framework in the existing long-term plan. A clear and logical rationale for the council’s activities so that selected levels of service with their associated performance measures and targets can be assessed and well understood by the public. Relevant performance measures that focus on the important aspects of the services that the council provides within the context of its broader service performance objectives and community outcomes. A mix of performance measures that are important to communities and cover different aspects of performance, such as quality, quantity, timeliness, and location, where appropriate. The selection of measures is aligned with planned changes in levels of service and any changes in investment. Service quality measures cover both the ratepayer/customer perspective and more technical assessments (for example, compliance of drinking water supplies with standards). Meaningful measures for community outcomes, where appropriate. Balanced reporting Open and honest reporting in the annual report on what went well and what didn’t go well, and a clear and concise explanation of how performance will be improved. Comparability Using trends and prior year comparatives to help readers understand targets in the long-term plan and actual performance in the annual report. Commentary and analysis Concise and understandable performance overviews and summaries in the annual report. A degree of focus in the annual report on performance improvements within the context of the commentary and analysis of the current year results. |
| What to avoid: |
|---|
| Measures Repeating what has been reported in past long-term plans and/or continually adding performance measures without considering what measures are most relevant to the council’s objectives, priorities, and planned levels of service. Including measures that are important to council managers but less important to the community. Including information simply because it is what the council has on hand. Including technical measures without explaining what they mean and their relevance. Using, and reporting against, only the mandatory measures set by the Department of Internal Affairs for the relevant groups of activities when there are other important levels of service planned that are not covered by the mandatory measures. Not focusing enough on the quality of service delivery. Relying only on surveys for assessing the quality of the council’s service delivery. Lacking a systematic process for recording relevant information at source. Balanced reporting Over-emphasis and reporting on only what went well. Comparability Not including prior year comparators in the long-term plan when setting targets. Commentary and analysis Focusing in the annual report only on what happened, without explaining the underlying reasons for any performance issues. |
Appropriate and meaningful mix of measures
Relevant and appropriate performance measures covering different dimensions of performance for the major aspects of the council’s activities are a core component of good performance reporting.
Otago Regional Council
 What we liked in Otago Regional Council’s 2021-2031 long-term plan and 2021/22 annual report
Public transport patronage measures are common for regional councils. Otago Regional Council’s long-term plan supports these measures with meaningful performance information that enhances their relevance.
| The next 10 years will be a challenging but exciting period for our public transport system as it responds to changes from population growth and movement to uncertain economic conditions. Technology is improving and more accessible, at the same time we have national goals to lower carbon emissions. Public transport will need to become the preferred mode of travel for more people more often to support broader societal, economic and environmental outcomes. Importantly this LTP signals, during this 10-year planning horizon, significant decisions on public transport infrastructure, particularly in Queenstown. At this stage Council is working with its partners to bring this vision to life for future community consideration. This programme faces challenges including:
|
In its annual report, it then usefully refers to specific initiatives during the year, such as allowing pets on buses during off-peak times and enclosed in carriers, and continuing a $2 fare trial.
| Public transport services were delivered in Dunedin and Queenstown throughout the year, along with customer experience initiatives such as free travel to key events, allowing pets on buses (off-peak and enclosed in carriers), continuation of the $2-fare trial, improvements to our Transit app which shows bus movements, and installing an e-stop at Arthurs Point, Queenstown. The Council also continued to contract a ferry service on Lake Whakatipu. Ferry service patronage for the 2021-22 year topped 60,000 users, a 12% increase on 2020-21. |
Selwyn District Council
 What we liked in Selwyn District Council’s 2021-2031 long-term plan
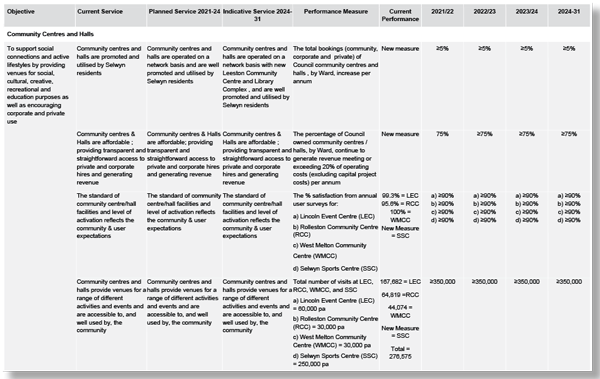
The Council uses a mix of measures that cover different aspects of performance – how well the community centres and halls are used, the extent to which costs are covered, and the satisfaction of those using these facilities.
Hawke’s Bay Regional Council
 What we liked in Hawke’s Bay Regional Council’s 2021/22 annual report
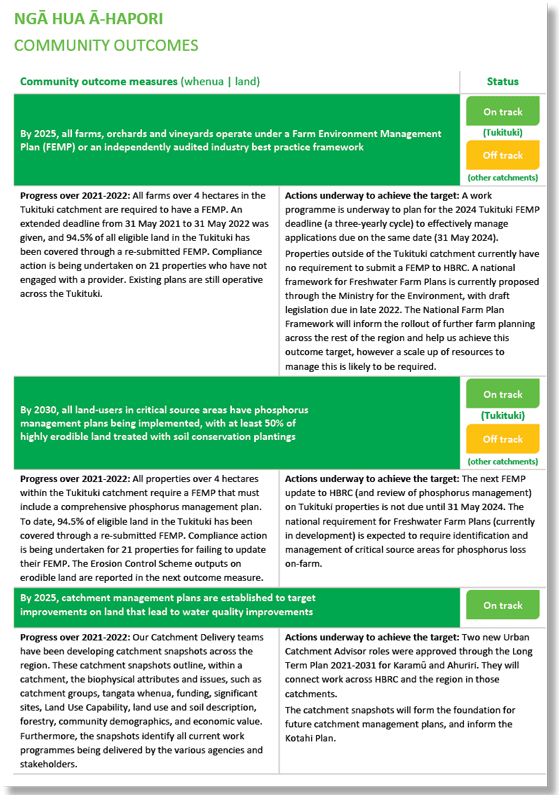
The Council has meaningful measures that are linked to community outcomes describing the difference the Council is making.
These are well described, with rich commentary about progress and actions needed for the next reporting period.
Christchurch City Council
 What we liked in Christchurch City Council’s 2021-2031 long-term plan
The Council has included measures that directly respond to concerns raised by residents about its libraries during its consultation process.
The section in the long-term plan called “Changes from the draft to the final plan” states that the Council has agreed to “maintain the current opening hours of Tūranga and many of our other libraries. Tūranga will also be open on five public holidays a year” and “maintain the Mobile Library Service for now, with users to be consulted on alternative service arrangements.”
The Council includes measures on library opening hours and supports these measures with a detailed footnote (see the example below). Setting measures on the library opening hours makes sense in this case because this clearly matters to the community.
The Council’s long-term plan has additional measures that cover a range of aspects of its service delivery – access, user satisfaction, and collections maintenance.
Libraries
| Levels of Service Performance Measures | Actual Results | LTP 2018-28 target 2020/21 | LTP 2021-31 Proposed Performance Targets | ||||
|---|---|---|---|---|---|---|---|
| 2018/19 | 2019/20 | 2021/22 | 2022/23 | 2023/24 | Year 10 2030/31 | ||
| Community spaces through a comprehensive network of libraries, and digital channels | |||||||
| 3.1.2.1 Residents have access to a physical and digital library relevant to local community need or profile | 52 to 74hrs | 52 to 74hrs | Metropolitan and Suburban | Provide weekly opening hours for existing libraries: 23-74 hours per week (as appropriate for metropolitan, suburban, and neighbourhood) | |||
| 48 to 57 hrs | 48 to 51 hrs* | 52 to 74hrs Suburban Medium 48 to 57 hrs |
|||||
| 36 to 57 hrs | 36 to 46 hrs* | Neighbourhood 36 to 57 hrs | |||||
* Result affected by impact of COVID-19 lockdown.
1 Post-consultation, the Council resolved to reinstate some Library opening hours, retaining the target of 23-74 hours, rather than 23-69 hours proposed in the draft LTP. These are the resolutions:
- Close Fendalton and Upper Riccarton libraries at 7 pm, rather than 6 pm as was proposed (2020/21 closing time 8pm).
- Retain South and Te Hāpua libraries' weekday closure at 7pm.
- Open Fingertip Library 1 day in the weekend.
- Close Sumner on Sundays, Open Aranui on Sundays.
- Linwood to stay open late on Thursdays.
- No change to Tūranga hours for public holidays as it is a central city anchor.
- Retain current 8pm closing at Tūranga.
Three provision measures from 2018 LTP have been merged into this one, as a result of a governance steer to reduce the volume of levels of service. The three levels of service for metropolitan, suburban and neighbourhood libraries have been merged into this single measure. In the 2018 LTP, the targets for these measures were as follows:
3.1.2.1 Metropolitan and Suburban 52 to 74 hrs
3.1.2.2 Suburban medium 48 to 57 hrs
3.1.2.3 Neighbourhood 36 to 57 hrs
The lower end of the range (23 hours) represents the inclusion of the Diamond Harbour Library which was not referenced in LTP 2018
Horowhenua District Council
 What we liked in Horowhenua District Council’s 2021-2041 long-term plan
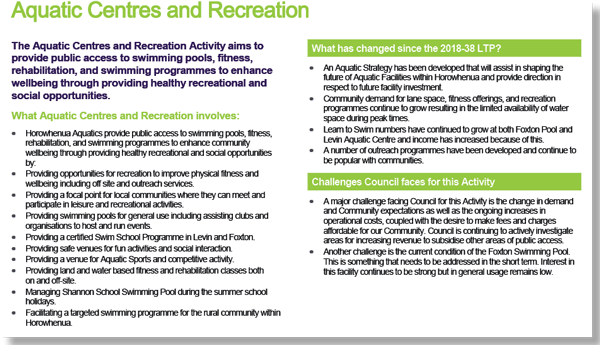
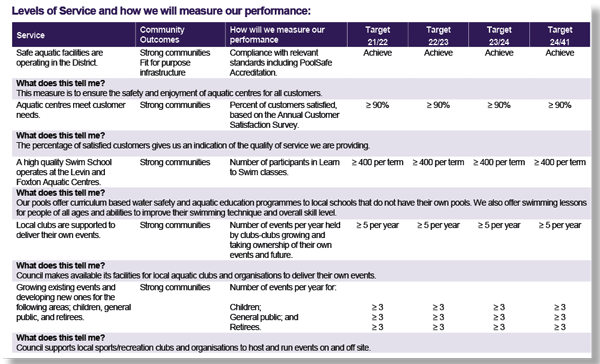
The performance measures about the aquatic centres cover different dimensions of performance and relate to what has changed since Horowhenua District Council’s previous long-term plan.
The Council is also clear on the purpose of the measures with its "What does this tell me?" explanations, which give readers a better understanding of the measure’s relevance.
Ashburton District Council
 What we liked in Ashburton District Council’s 2021-2031 long-term plan and 2021/22 annual report
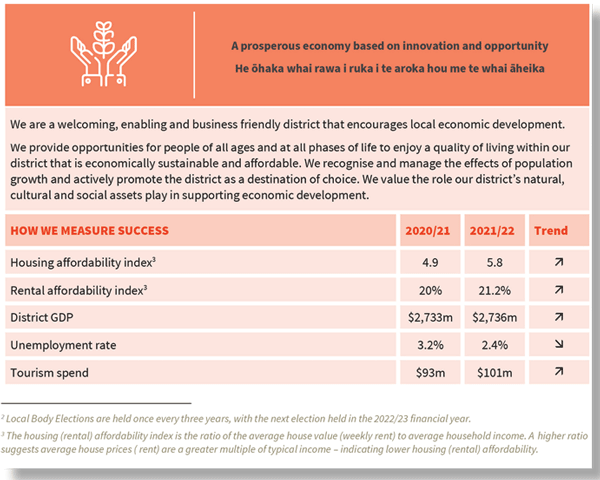
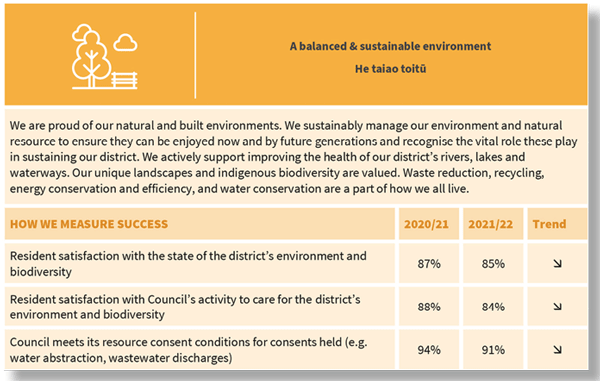
The community outcomes are clearly defined, with high-level meaningful success measures for each outcome in the long-term plan.
The Council presents the current and previous year results and trend relating to the community outcomes in its annual report (extracts below). This information contributes to the Council’s broader story of performance.
Balanced reporting on what went well and what didn’t go well
When Councils are transparent and open about their overall performance, including what didn’t go well, and present this information with due prominence in their annual report, this will likely enable more trust in the performance information in the annual report.
Whangārei District Council
 What we liked in Whangārei District Council’s 2021/22 annual report
The annual report had an effective visual representation of the Council’s overall performance for the current year and the two previous years, which enables the community to clearly see when performance objectives have and have not been achieved. The breakdown by activity for the current year further enhanced the performance information.
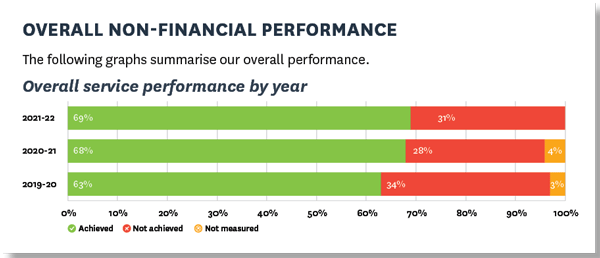
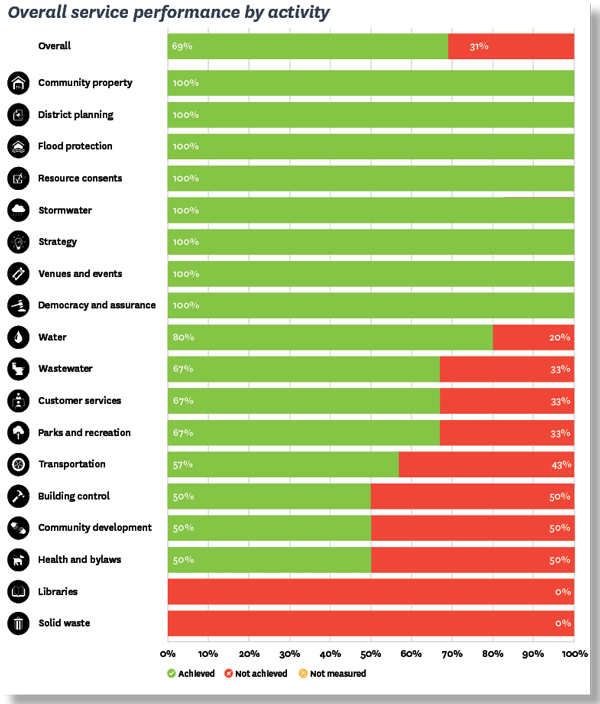
In reporting on its resident satisfaction survey results, the Council noted that it also asked residents for their views on its forward-planning priorities. Publishing the results of the survey provided transparency about those views. We note that the results can also act as a check for the Council on whether its performance reporting framework is covering the issues that are most important to the community.
In sharing residents’ views that making Whangārei safer is the most important community outcome, the Council has openly highlighted the downturn in its results on safety in the district.
The survey asks residents for their opinions on the forward planning priorities for Council. These provide guidance on focus areas and this year the items that gained the most support included:
|
Mackenzie District Council
 What we liked in Mackenzie District Council’s 2021/22 annual report
The Council presents its activity performance information using three headings: “What we did”, “Challenges/issues we experienced”, and “Looking ahead”.
These set it up well to provide clear contextual information in a consistent way, including on the challenges the Council faced in achieving its planned performance. The Council also concisely describes its commitment to achieving the targets.
3.5 Transportation Measure 4: The percentage of road users satisfied with the roading network
| 2019/20 | 2020/21 | 2021/22 | |
|---|---|---|---|
| Target: | ≥85% | ≥85% | ≥85% |
| Result: | 79% | 76%* | 43% |
*This figure includes a 37% ‘neutral’ response which was included in the ‘Achieved’ result in 2020/21. In 2021/22 a ‘neutral’ response of 26% excluded from the ‘Achieved’ result.
| What we did: Of those surveyed, 56% stated that they were satisfied with our urban roading network, 31% were satisfied with our rural road network and 43% stated they were satisfied with our footpaths. This is an average satisfaction of 43%. This did not meet our target for 2021/22. The neutral tally from our respondents was 26%. Challenges/issues we experienced: At the end of May 2021, we experienced a significant flooding event that affected sections of the rural network. With approximately $2 million worth of damage and limits to how much Council could fund, remediation work was prioritised and incorporated into our maintenance programme. However, we were able to bring our roads back to an appropriate level of service and build some resilience to the network. Looking ahead: We will continue to focus on improving the experience for our road users and remain committed to ensuring we undertake effective maintenance and improvements to our roading network in a timely manner with minimum disruption. We will also continue to look for new innovative ways of undertaking works and maintenance. Council sees the need to improve the capacity of our infrastructure through future renewal and improvement programmes to improve the resilience of the roading network, mitigate the effect of the expected increased frequency of larger scale weather events, support local growth and development, and ensure maintenance is cost effective. This is especially important given the reliance on our network by local families and businesses, rural sector seasonal peaks and visitors to our District; and the modern prevalence of a just-in-time supply chain sector. |
3.6 Regulatory Services Measure 6: IANZ accreditation is retained
Target: Accreditation is retained (our next accreditation assessment is due in July 2023).
| 2019/20 | 2020/21 | 2021/22 |
|---|---|---|
| ✔ | ✔ | ✔ |
| What we did: We continued to process building consents and code compliance certificates in accordance with our International Accreditation New Zealand (IANZ) accreditation requirements and ensured our documentation and processes remained relevant and current. Challenges/issues we experienced: A full assessment of Council’s Building Consents Authority (BCA) policies, processes and procedures was performed by IANZ during July 2021 to ensure the requirements of our BCA accreditation were met. The final assessment report issued by IANZ dated 21 September 2021 categorised Council’s BCA as low risk. The assessment only identified six non-compliances in total of which none were serious and two were cleared during the assessment process. There were four remaining outstanding non-compliances. IANZ was satisfied Council’s BCA had a suitable plan and sufficient resources to address all non-compliances identified. Looking ahead: Council’s next accreditation assessment is due in July 2023. In the interim we will continue to monitor the requirements in relation to the Building (Accreditation of Building Consent Authorities) Regulations 2006 to ensure Accreditation is retained at all times and prepare for our next audit. |
Comparability
It is good practice for long-term plans to present the latest result available for each performance measure. Setting targets within the context of current performance allows readers to see whether a council is planning to maintain, decrease, or increase its levels of service.
We liked annual reports that used trends and benchmarks to give a clear picture of service delivery and progress against broader achievements over time.
Christchurch City Council
 What we liked in Christchurch City Council’s 2021-2031 long-term plan
The Council presents two years of prior year comparatives, which provides good context for its planned levels of service for the new long-term plan.
It also provides its year 3 target from the previous long-term plan (as the actual result would not have been available at that time).
Parks and Foreshore
| Levels of Service | Actual Results | LTP 2018-28 target 2020/21 | LTP 2021-31 Proposed Performance Targets | ||||
|---|---|---|---|---|---|---|---|
| 2018/19 | 2019/20 | 2021/22 | 2022/23 | 2023/24 | Year 10 2030/31 | ||
| All Parks – Provision, Maintenance, Asset Condition and Performance | |||||||
| 6.8.2.3 Parks are managed and maintained in a clean, tidy, safe, functional and equitable manner (Asset Performance) | 84% | 91% | Sports fields - condition average or better: 70% | At least 90% of parks and associated public recreational assets are available for safe public use during opening hours.1 | |||
| 6.8.5 Satisfaction with the overall availability of recreation facilities within the city’s parks and foreshore network. | 74% | 75% | Resident satisfaction with range and quality of recreation facilities within Parks: 85%. | Resident satisfaction with the availability of recreation facilities across the parks and foreshore network: 70%2 | |||
1 Target revised from a condition rating, to reflect availability of use instead, and is expanded to all recreational assets not just sports fields
2 Previous target “Range and quality of recreation opportunities” replaced by “Availability of recreation facilities”. Target revised from 85% satisfaction to 70% satisfaction to reflect budget levels.
Environment Canterbury Regional Council
 What we liked in Environment Canterbury’s 2021/22 annual report
The Council shows long-term trends over 20 years to show progress in relation to air quality across
its region.
The Council provides thorough commentary on the performance of air quality against the national standard, explaining the trends over time.
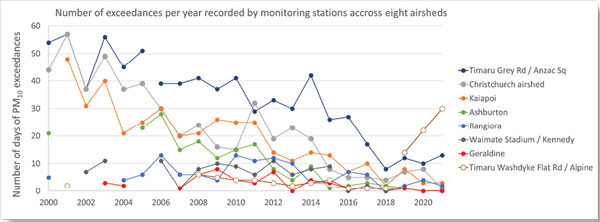
| PM10 exceedances in Canterbury in 2021 In 2021, four out of the eight airsheds in Canterbury complied with the national standard. These airsheds were in Ashburton, Christchurch, Geraldine and Waimate. Kaiapoi, Rangiora and Timaru all had more than one PM10 exceedance in 2021. We are continuing to work with households in these urban centres to install better forms of home heating and reduce emissions from wood burning. The Washdyke airshed has continued to see the number of PM10 exceedances increasing year-on-year since the monitoring site was moved to a new location in 2019, with 30 exceedances recorded for 2021. In this airshed, there are more coarse particles which indicate that it is likely these are coming from industry activities in the area such as road dust, unpaved areas, industrial wood and coal fuelled boilers and sea salt given the proximity of Washdyke to the sea. We are continuing to work with Timaru District Council and industry to find ways to address this issue. |
Hawke’s Bay Regional Council
 What we liked in Hawke’s Bay Regional Council’s 2021/22 annual report
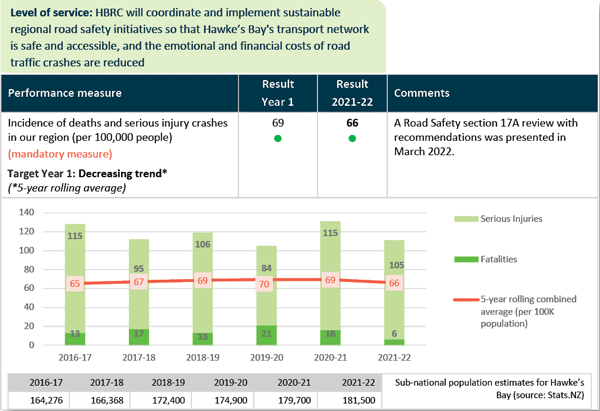
The Council uses trends to effectively show progress over time for measures such as annual patronage of bus services for the past 10 years and incidence of deaths and serious injury crashes for the past seven years. This gives a clear picture of impact/effectiveness over time.
Trends used to show patronage on bus services:
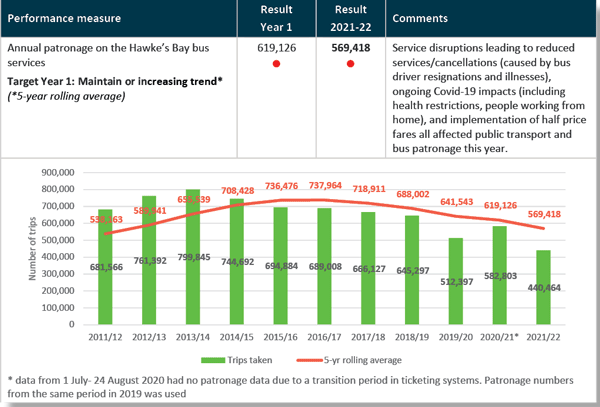
Trends used to show the incidence of death and serious injury crashes over a five-year period:
Taranaki Regional Council
 What we liked in Taranaki Regional Council’s 2021/22 annual report
The Council embeds trends in the measures and its reporting. The reporting provides a useful breakdown of the results from the trend analysis.
1 Protection of the life-supporting capacity of water, in-stream uses and values
| PROGRAMMED LEVEL OF SERVICE | REPORTED LEVEL OF SERVICE |
|---|---|
| Measure: Macroinvertebrate Community Index (MCI) values (a measure of freshwater community richness and composition) at least 50 regionally representative sites. Target (Years 1-10): The proportion of sites showing a trend (whether significant or indicative) of improvement in MCI against a base year of 1995 to exceed the proportion showing decline over the same period. Baseline: There is a continuing regional trend of improvement in the quality of freshwater ecology across the region. MCI values were determined for 59 regionally significant sites. Trend analysis to June 2019 (from 1995) shows 25 sites of 59 with statistically significant trends of improvement, and one with a significant decline. |
MCI values have been determined for 63 regionally significant sites. Trend analysis has been undertaken for the period to June 2021 (from 1995) for 56 sites with sufficient data. Results show 36 sites (64%) with an improving trend and 12 sites (21%) degrading. There were 8 sites (14%) where trends were indeterminate. There is a decreasing downstream gradient of macroinvertebrate health from ‘A’ band to ‘D’ band (based on the NPS-FM grading criteria) in ring plain streams. The MCI state of the environment monitoring programme continued during the 2021/2022 year. |
* Adapted from the original Taranaki Regional Council table.
Hutt City Council
 What we liked in Hutt City Council’s 2021/22 annual report
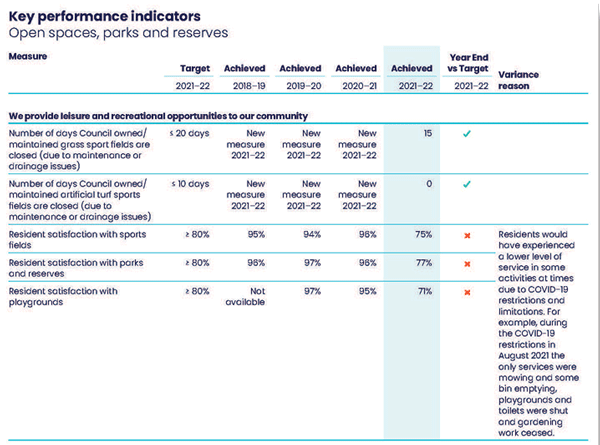
This Council gives three years of previous comparatives. This gives useful context to understand the current year’s results and enables readers to get a picture of trends over time.
The Council then supports the results with an explanation for why the current year target was not achieved and why there was a decline in the trend.
Commentary and analysis
Good performance reporting will include meaningful analysis and commentary on the reported results for the performance measures, where relevant and needed.
Hamilton City Council
 What we liked in Hamilton City Council’s 2021/22 annual report
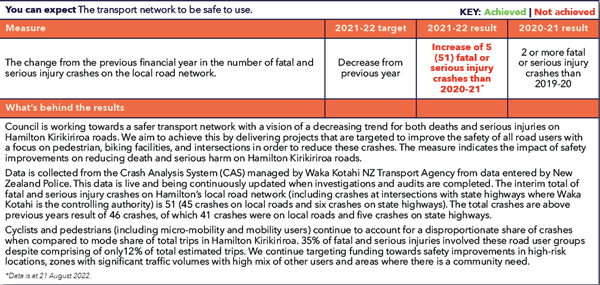
The Council provides rich information and analysis for measures (such as the road crashes measure) by describing in detail “what’s behind the results”. For example, it identifies the disproportionate share of crashes for cyclists and pedestrians, and comments on how it is responding to that issue.
Fatal road crashes
Mackenzie District Council
 What we liked in Mackenzie District Council’s 2021/22 annual report
The Council gives relevant and meaningful contextual information on its performance. In this example, the Council describes the trade-offs it has made in service delivery. The reporting includes meaningful commentary on why performance significantly exceeded the target.
3.5 Transportation Measure 3:
The percentage of the unsealed road network renewed using wearing course and stabilisation techniques
| 2019/20 | 2020/21 | 2021/22 | |
|---|---|---|---|
| Target: | ≥2% | ≥2% | ≥2% |
| Result: | 6% | 8% | 30% |
| What we did: During the 2021/22 year Council applied 22,093 m3 of granular material on our unsealed roads; 156.6 km of maintenance metalling at about 20mm average depth. This exceeded our target for 2021/22. The total area covered has increased from previous years as we have focussed on applying more meterage of thin gravel layers rather than deeper lift treatment. We also applied additional patch maintenance gravel to specific areas of our lower volume roads to aid in grader maintenance. Challenges/issues we experienced: The loss of gravel from our unsealed roads can be caused by a number of factors including changes to the use of the road and environmental conditions (e.g. weather conditions and events). Sourcing maintenance materials is also challenging. On average, we lose approximately 17mm of gravel from our unsealed roads every year with some of our higher volume roads losing up to 42mm per year. To help minimise gravel loss, we add clay to our maintenance gravel to bind the surface. This extends the longevity and reduces the frequency of maintenance. Whilst this wearing course treatment increases longevity of our unsealed roading assets, the cost is slightly higher than maintenance metal treatments. We prioritise the use of this on our higher volume roads. Balancing our maintenance methods and costs is a continual challenge for us. Looking ahead: We will continue to monitor and maintain our unsealed road network. When needed, we will plan renewals and/or improvements. We are continually reviewing our roads and innovating ways to maintain our current levels of service while minimising the cost of maintenance. We have a number of weathered rock sites in raw source which we have successfully blended with our crushed river aggregate source to improve its performance and achieve longer life this material. |
|||
Horizons Regional Council
 What we liked in Horizons Regional Council’s 2021/22 annual report
The Council provides rich analysis for resource consents and uses a good balance of statistics and narrative in reporting on its monitoring performance. (Note that “HAIL” is defined as Hazardous Activities and Industries List.)
| Resource Consent and Pollution Management Over this reporting year, staff focussed their monitoring activity on the resource consents that have the potential to have the greatest environmental risk. A total of 2068 consents were assessed during the year, of which 63 percent were fully compliant with their conditions. 16 percent of assessed consents received Low non-compliance grading, 9 percent received Medium and, 13 percent received Significantly Non Compliant gradings. Consent holders are generally more aware of potential consequences of non-compliances and are proactive in notifying problems to Horizons along with their actions to remedy or mitigate potential effects on the environment. Information continues to be provided to consent holders, and staff are available to undertake additional inspections when requested. Additionally, staff continue to take appropriate enforcement action in the event non-compliance is identified. This has resulted in 13 Formal Warnings, 52 Infringement Notices and 46 Abatement Notices being issued. Six matters were brought before the Courts. The year has also seen Horizons continue to either process or receive a significant number of complex and high-profile consent applications. For example, Council has continued to progress a number of wastewater treatment plants which has seen both the Eketahuna and Pahiatua plants now operating under a new consent regime. Approximately 261 resource consent applications were granted, resulting in 806 activities being authorised, of which 79 percent were processed within statutory timeframes. The reporting year saw 1265 incidents received and responded to. This is a slight increase from 2020-2021 year, that saw 1226 incidents received. Three hundred and twenty one (321) HAIL requests were received and responded to. Most requests relate to purchasers undertaking due diligence as part of a sale and purchase process. In addition to the above, staff have continued to be involved in the implementation of national regulations such as the National Environmental Standard - Freshwater, National Environmental Standard – Plantation Forestry and National Environmental Standard – End of Life Tyres, and proposals for Resource Management Act reform. Regulatory advice has been provided to significant infrastructure projects such as Otaki to North Levin highway re-alignment and repowering of the Te Rere Hau Windfarm. A number of performance measures were not met this year as a result of:
|
Otago Regional Council
 What we liked in Otago Regional Council’s 2021/22 annual report
In its commentary and analysis in the annual report, the Council is transparent about its decision for services to run on a reduced timetable if reliability rates drop below 90% for three consecutive workdays.
The Council notes that this threshold was not required in 2021/22 but was triggered in July 2022.
| Challenges Bus services were punctual and reliable for most of the year, with increasing challenges in quarter four as cancelled services escalated following driver illness and driver shortages. Just 92% of trips operated in April- June. In March, Council approved services to run on a reduced timetable if reliability rates dropped below 90% for three consecutive weekdays. Although this wasn’t required in the 2021-22 financial year, this threshold was triggered in July 2022, the new financial year. The higher level of missed services has had a minor impact on patronage rates. However, in the first half of the year major factors hit patronage, mostly related to the Covid-19 pandemic. Despite some recovery, the network and the region remain impacted with annual patronage rates below target. Queenstown patronage was down by 9% to 806,820 compared to 2020-21; and Dunedin patronage was down by 13% to 2,367,099 compared to 2020-21. Half-price fares from central government in April led to a slight increase in patronage, but not sufficient to counteract the patronage shortfall from earlier in the year. This was the first year of the Council’s 2021-31 Regional Land Transport Plan (RLTP). The RLTP enables Waka Kotahi NZ Transport Agency to provide financial assistance to regional and district councils for qualifying transport activities, such as public transport. Throughout the year, the Otago and Southland Regional Transport Committees continued to meet productively. |
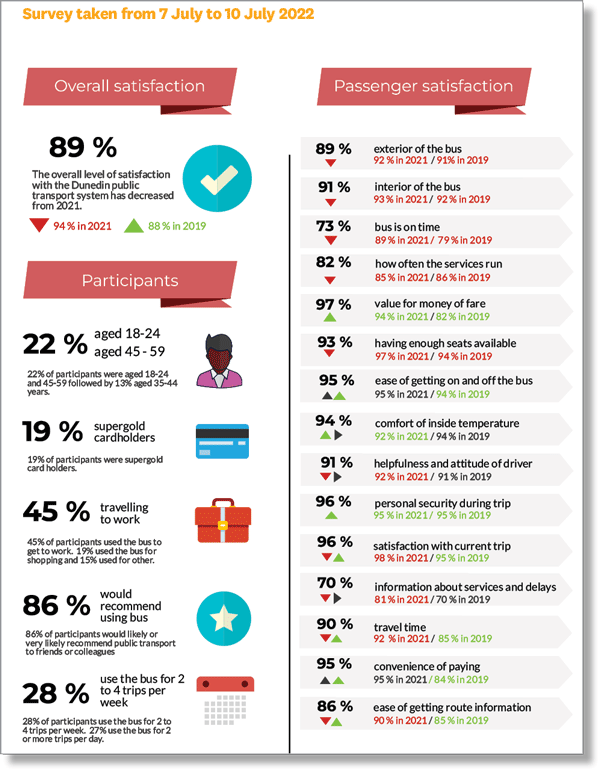
It also gives a detailed breakdown of customer satisfaction. Although presented simply as data, it provides interesting and useful additional performance information at a glance. The example below relates to the Dunedin public transport system.
