Specifying impacts/outcomes and reporting on progress over time
Our general observations
We saw some public organisations clearly identify and report their impacts in their annual reports. However, many need to improve in this area. Impact measures were particularly important when higher-level outcome indicators spanned multiple years or involved multiple public organisations and factors. We liked annual reports that set the results within the context of useful comparators and historical trend information.
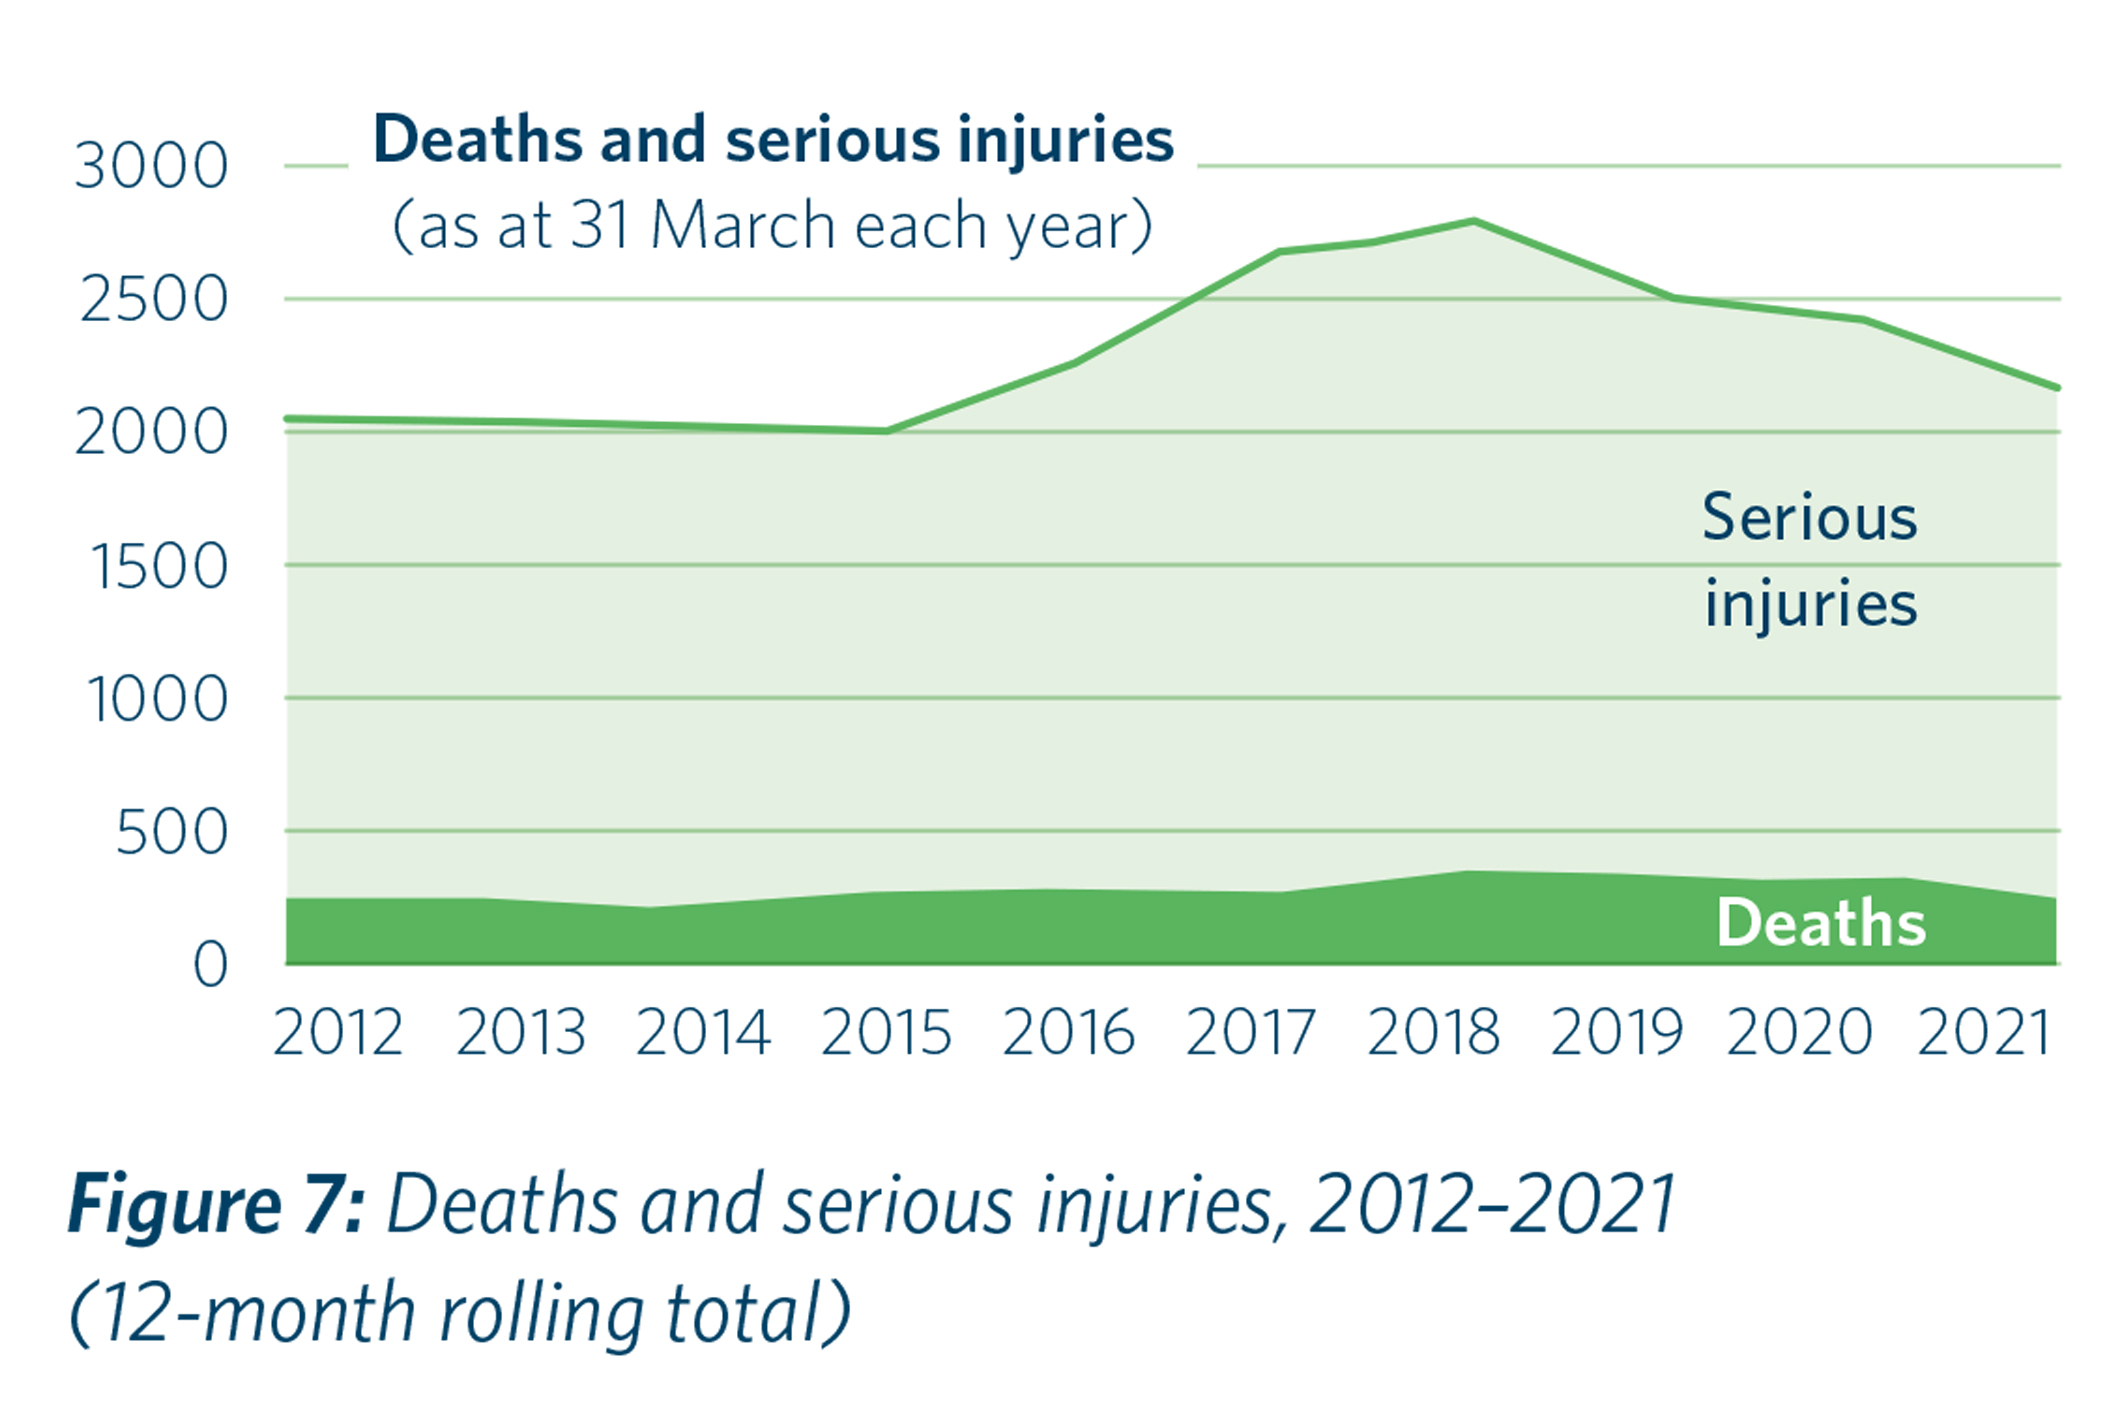
Waka Kotahi NZ Transport Agency
Waka Kotahi NZ Transport Agency's 2020/21 Annual Report sets out key indicators that are meaningful for assessing progress on what it intends to achieve through its key initiatives. This helps provide a rich account of its performance and how it is making a difference.
What we liked:
- Meaningful strategic measures for assessing progress on what it intends to achieve.
- Headline indicator for a range of key initiatives.
- Trends give a clear picture of impact/effectiveness over time.
- Meaningful commentary on the results and underlying factors (see page 28 of the annual report).

New Zealand Customs Service
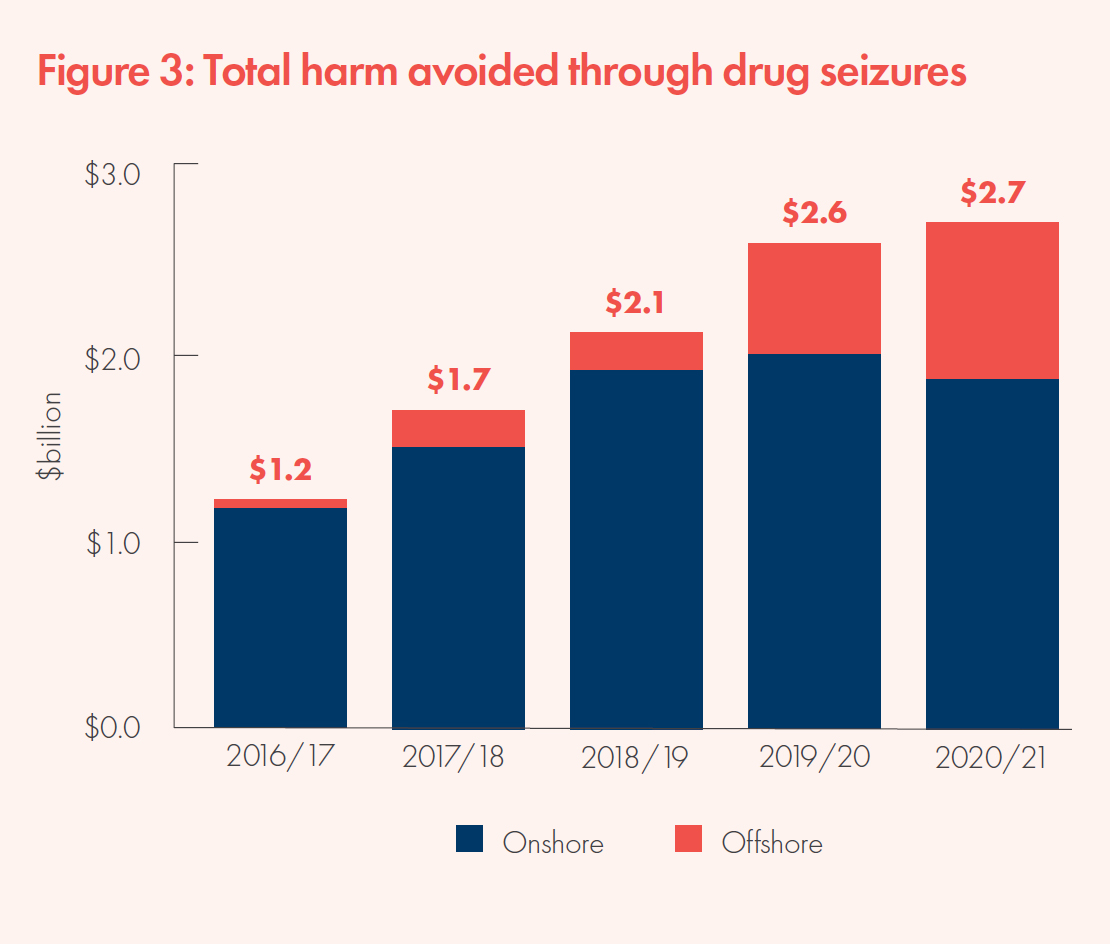
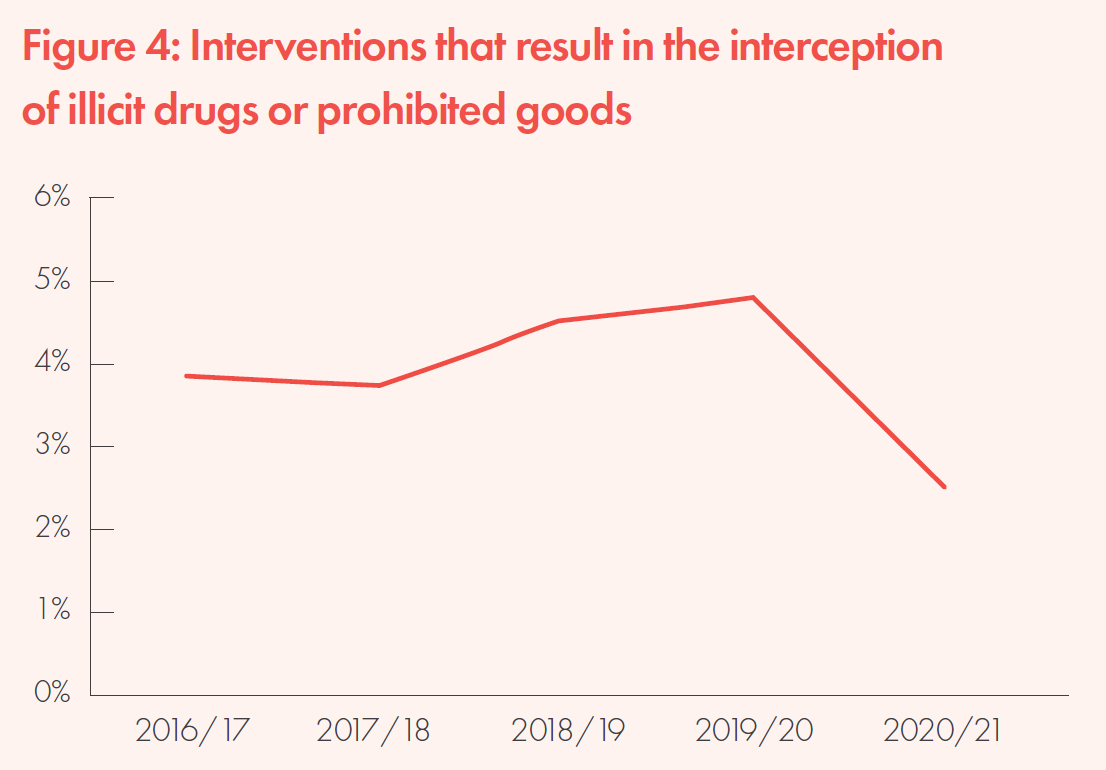
New Zealand Customs Service's 2020/21 Annual Report clearly identifies the impact of its services alongside meaningful and relevant measures.
What we liked:
- Measures were reviewed to better align them with the different layers of the performance framework.
- Reporting and measures focus on impacts, which are attributable to its services and are meaningful to the public.
- Trends give clear picture of impact/effectiveness over time.
- Commentary is meaningful – for example, commentary on the sharp decline in interception rates 2020/21 (see page 20 of the annual report).



Accident Compensation Corporation
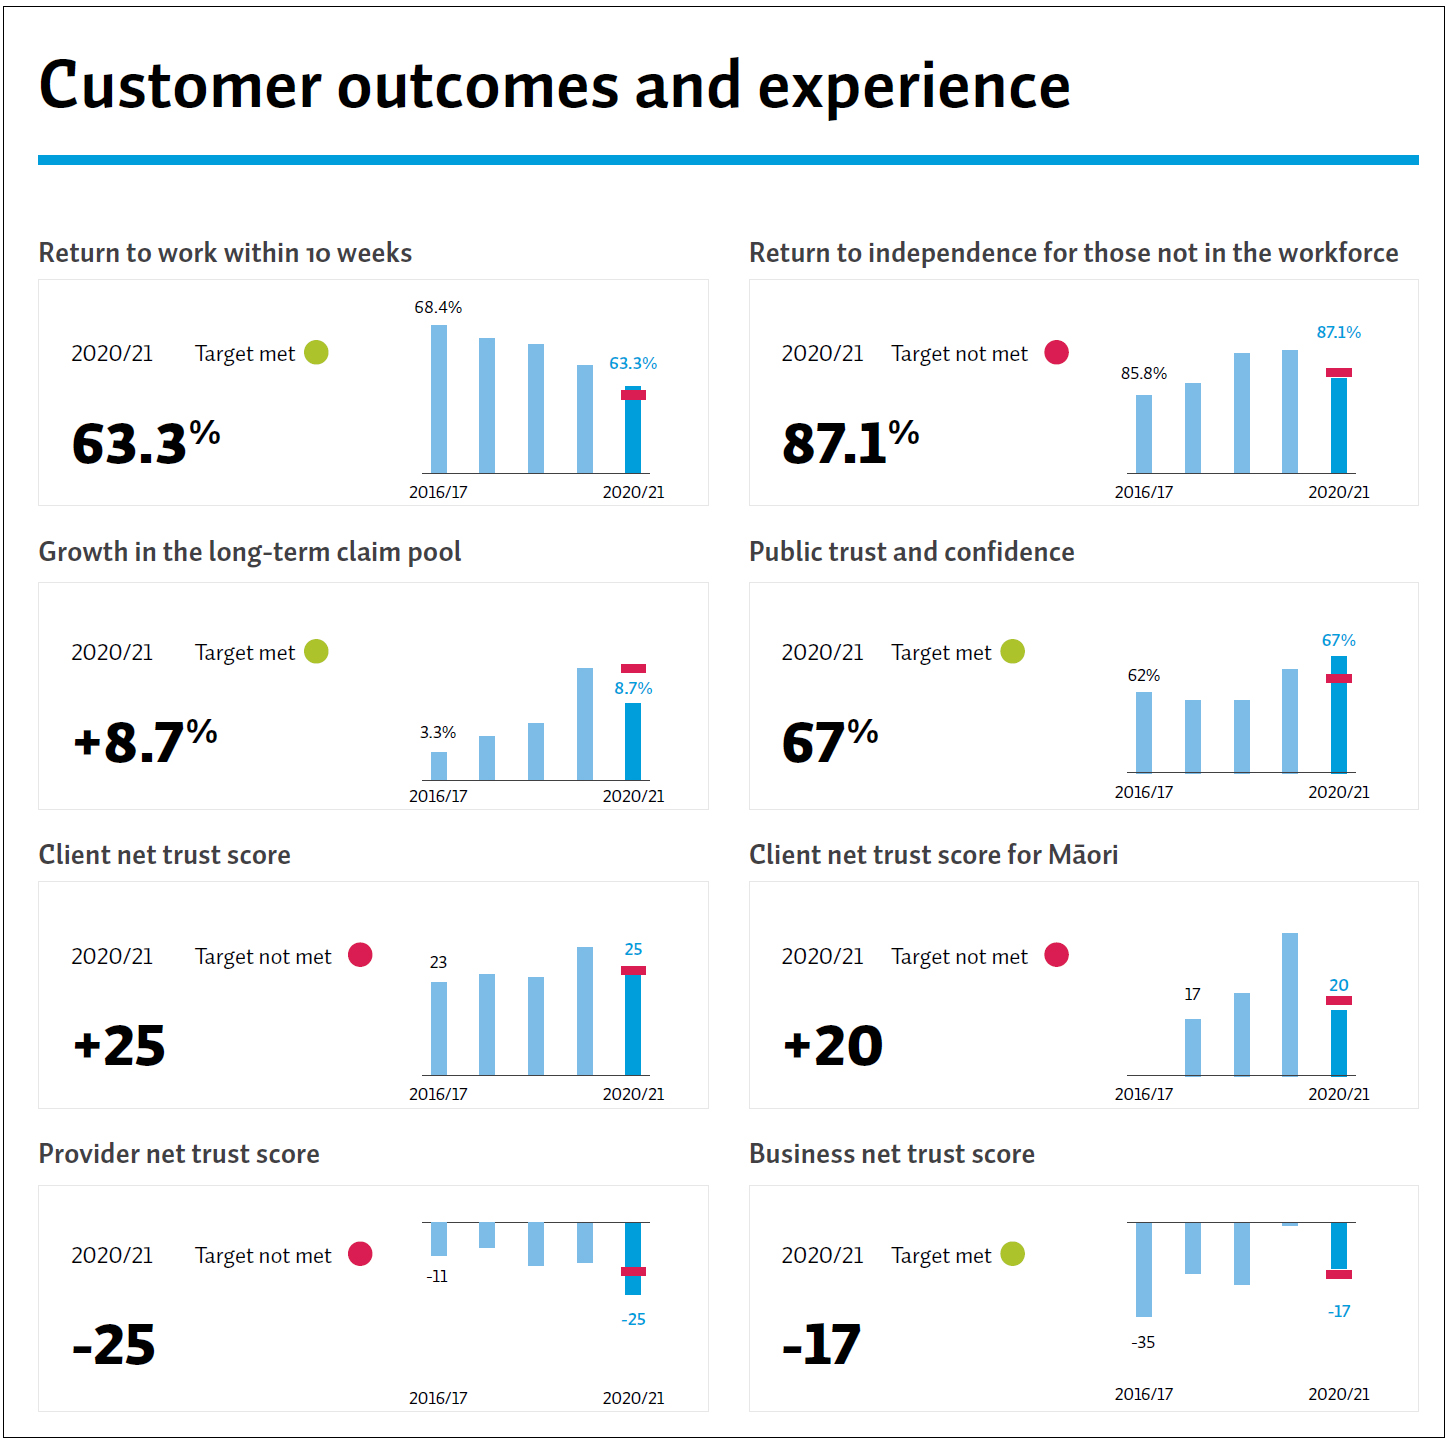
Accident Compensation Corporation’s 2020/21 Annual Report provides a broad suite of customer outcome and experience measures with good trend information for assessing their impacts.
What we liked:
- Reporting a set of relevant and appropriate measures relating to each impact/strategic intentions, including trend information.
- Technical definitions of the measures are provided in a glossary.
Maritime New Zealand
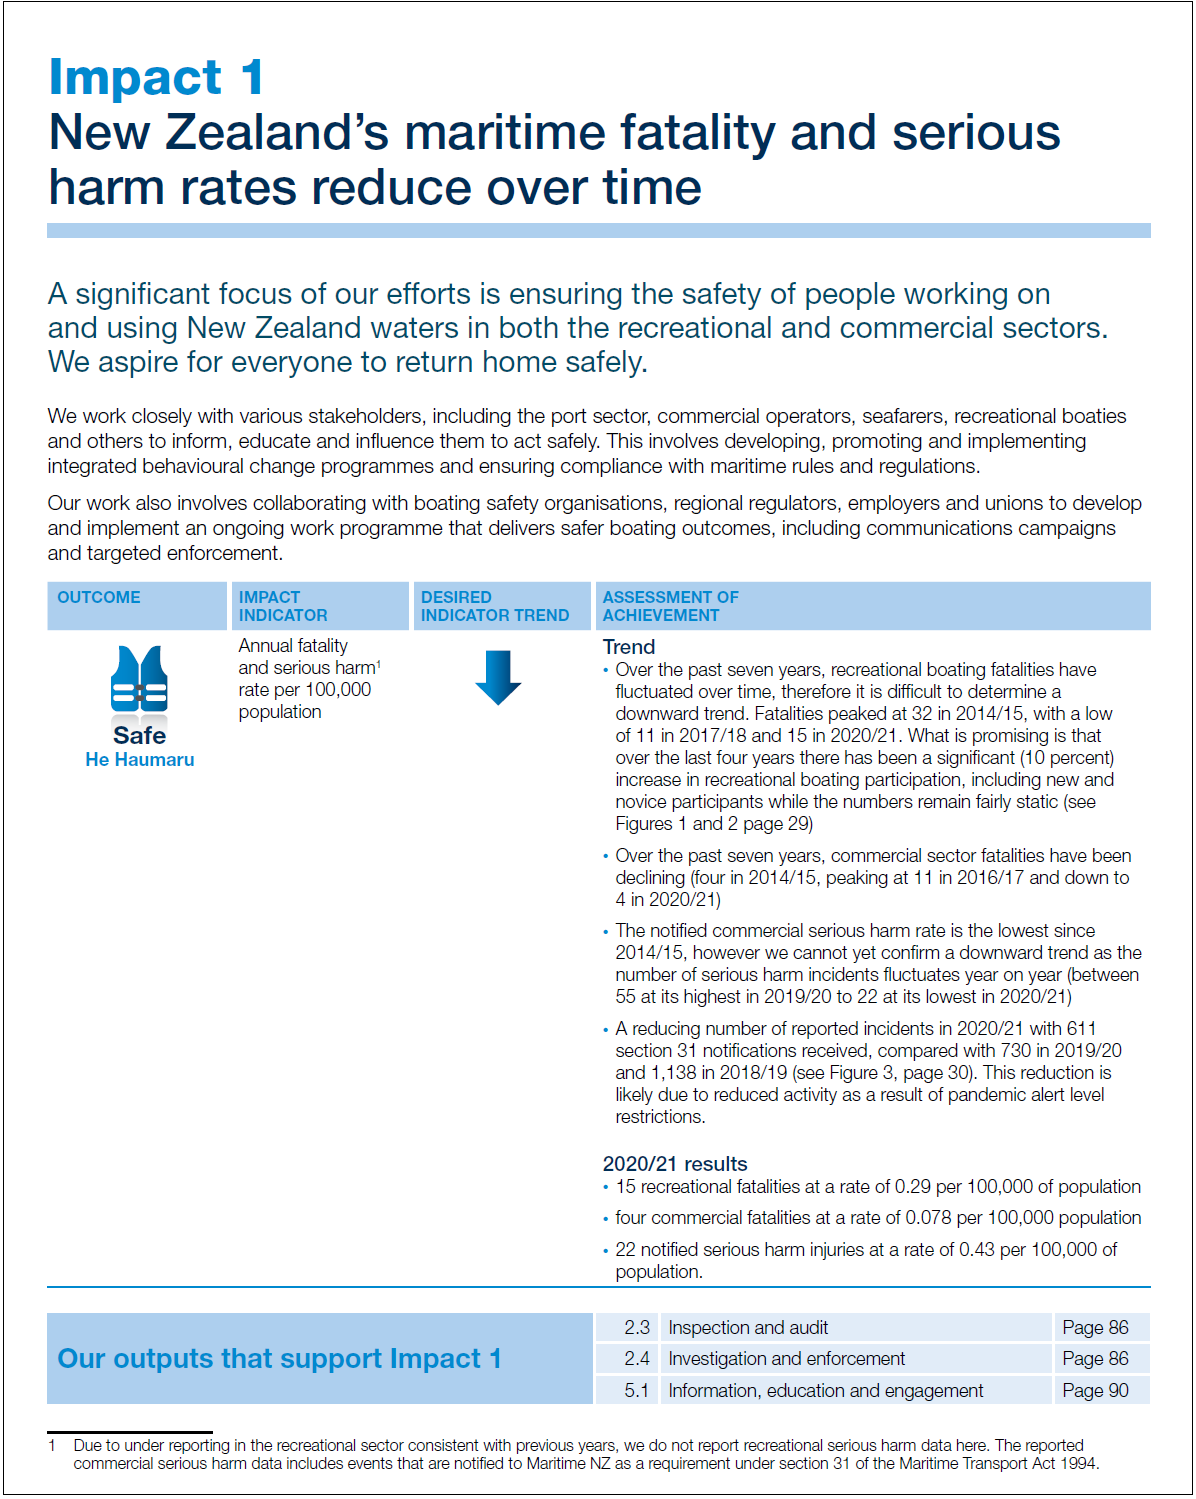
Maritime New Zealand’s 2020/21 Annual report includes meaningful impact indicators that are clearly linked to their outputs and wider outcomes.
What we liked:
- Meaningful impact indicators directly linked to the impact and wider outcome.
- Outputs that support each impact are identified.
- Trends are clearly explained and presented later in the annual report.
Guardians of New Zealand Superannuation
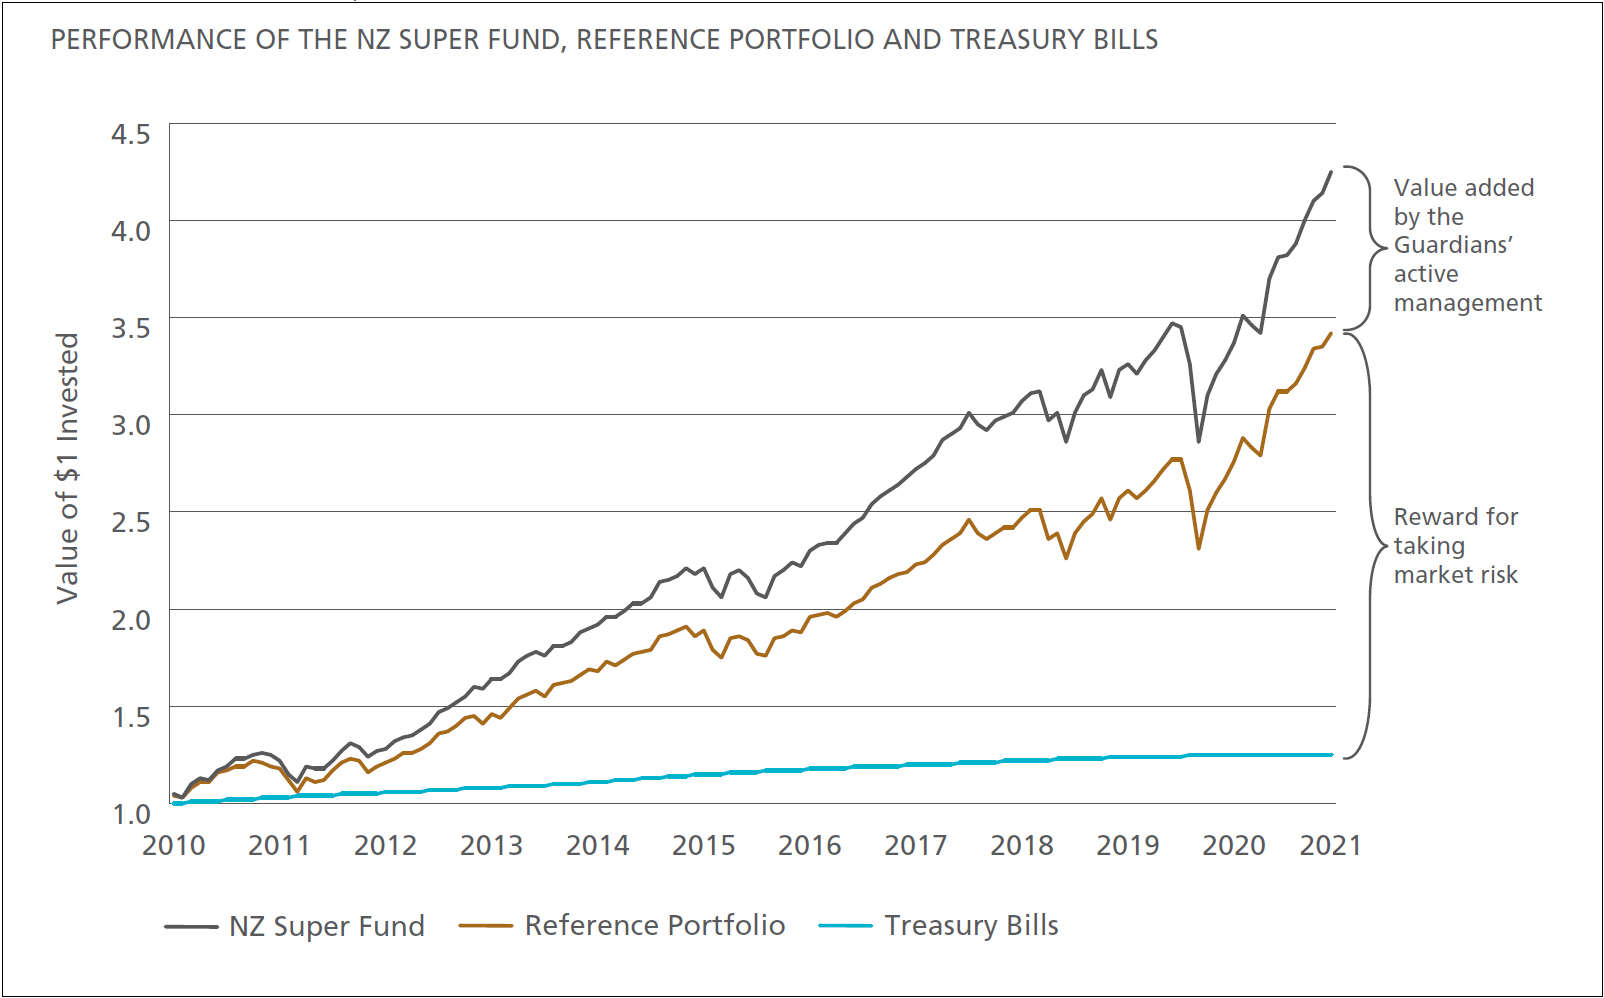
The Guardians of New Zealand Superannuation’s 2020/21 Annual Report presents meaningful trend and comparative performance information that helps provide a rich account of how well it has performed.
What we liked:
- Relevant and appropriate measures and comparators/benchmarks of its impact and value of management activities.
- Information is presented in a simple way for users to understand.
- Long-term trend is shown.
- Supporting analysis is comprehensive, relevant, and understandable.
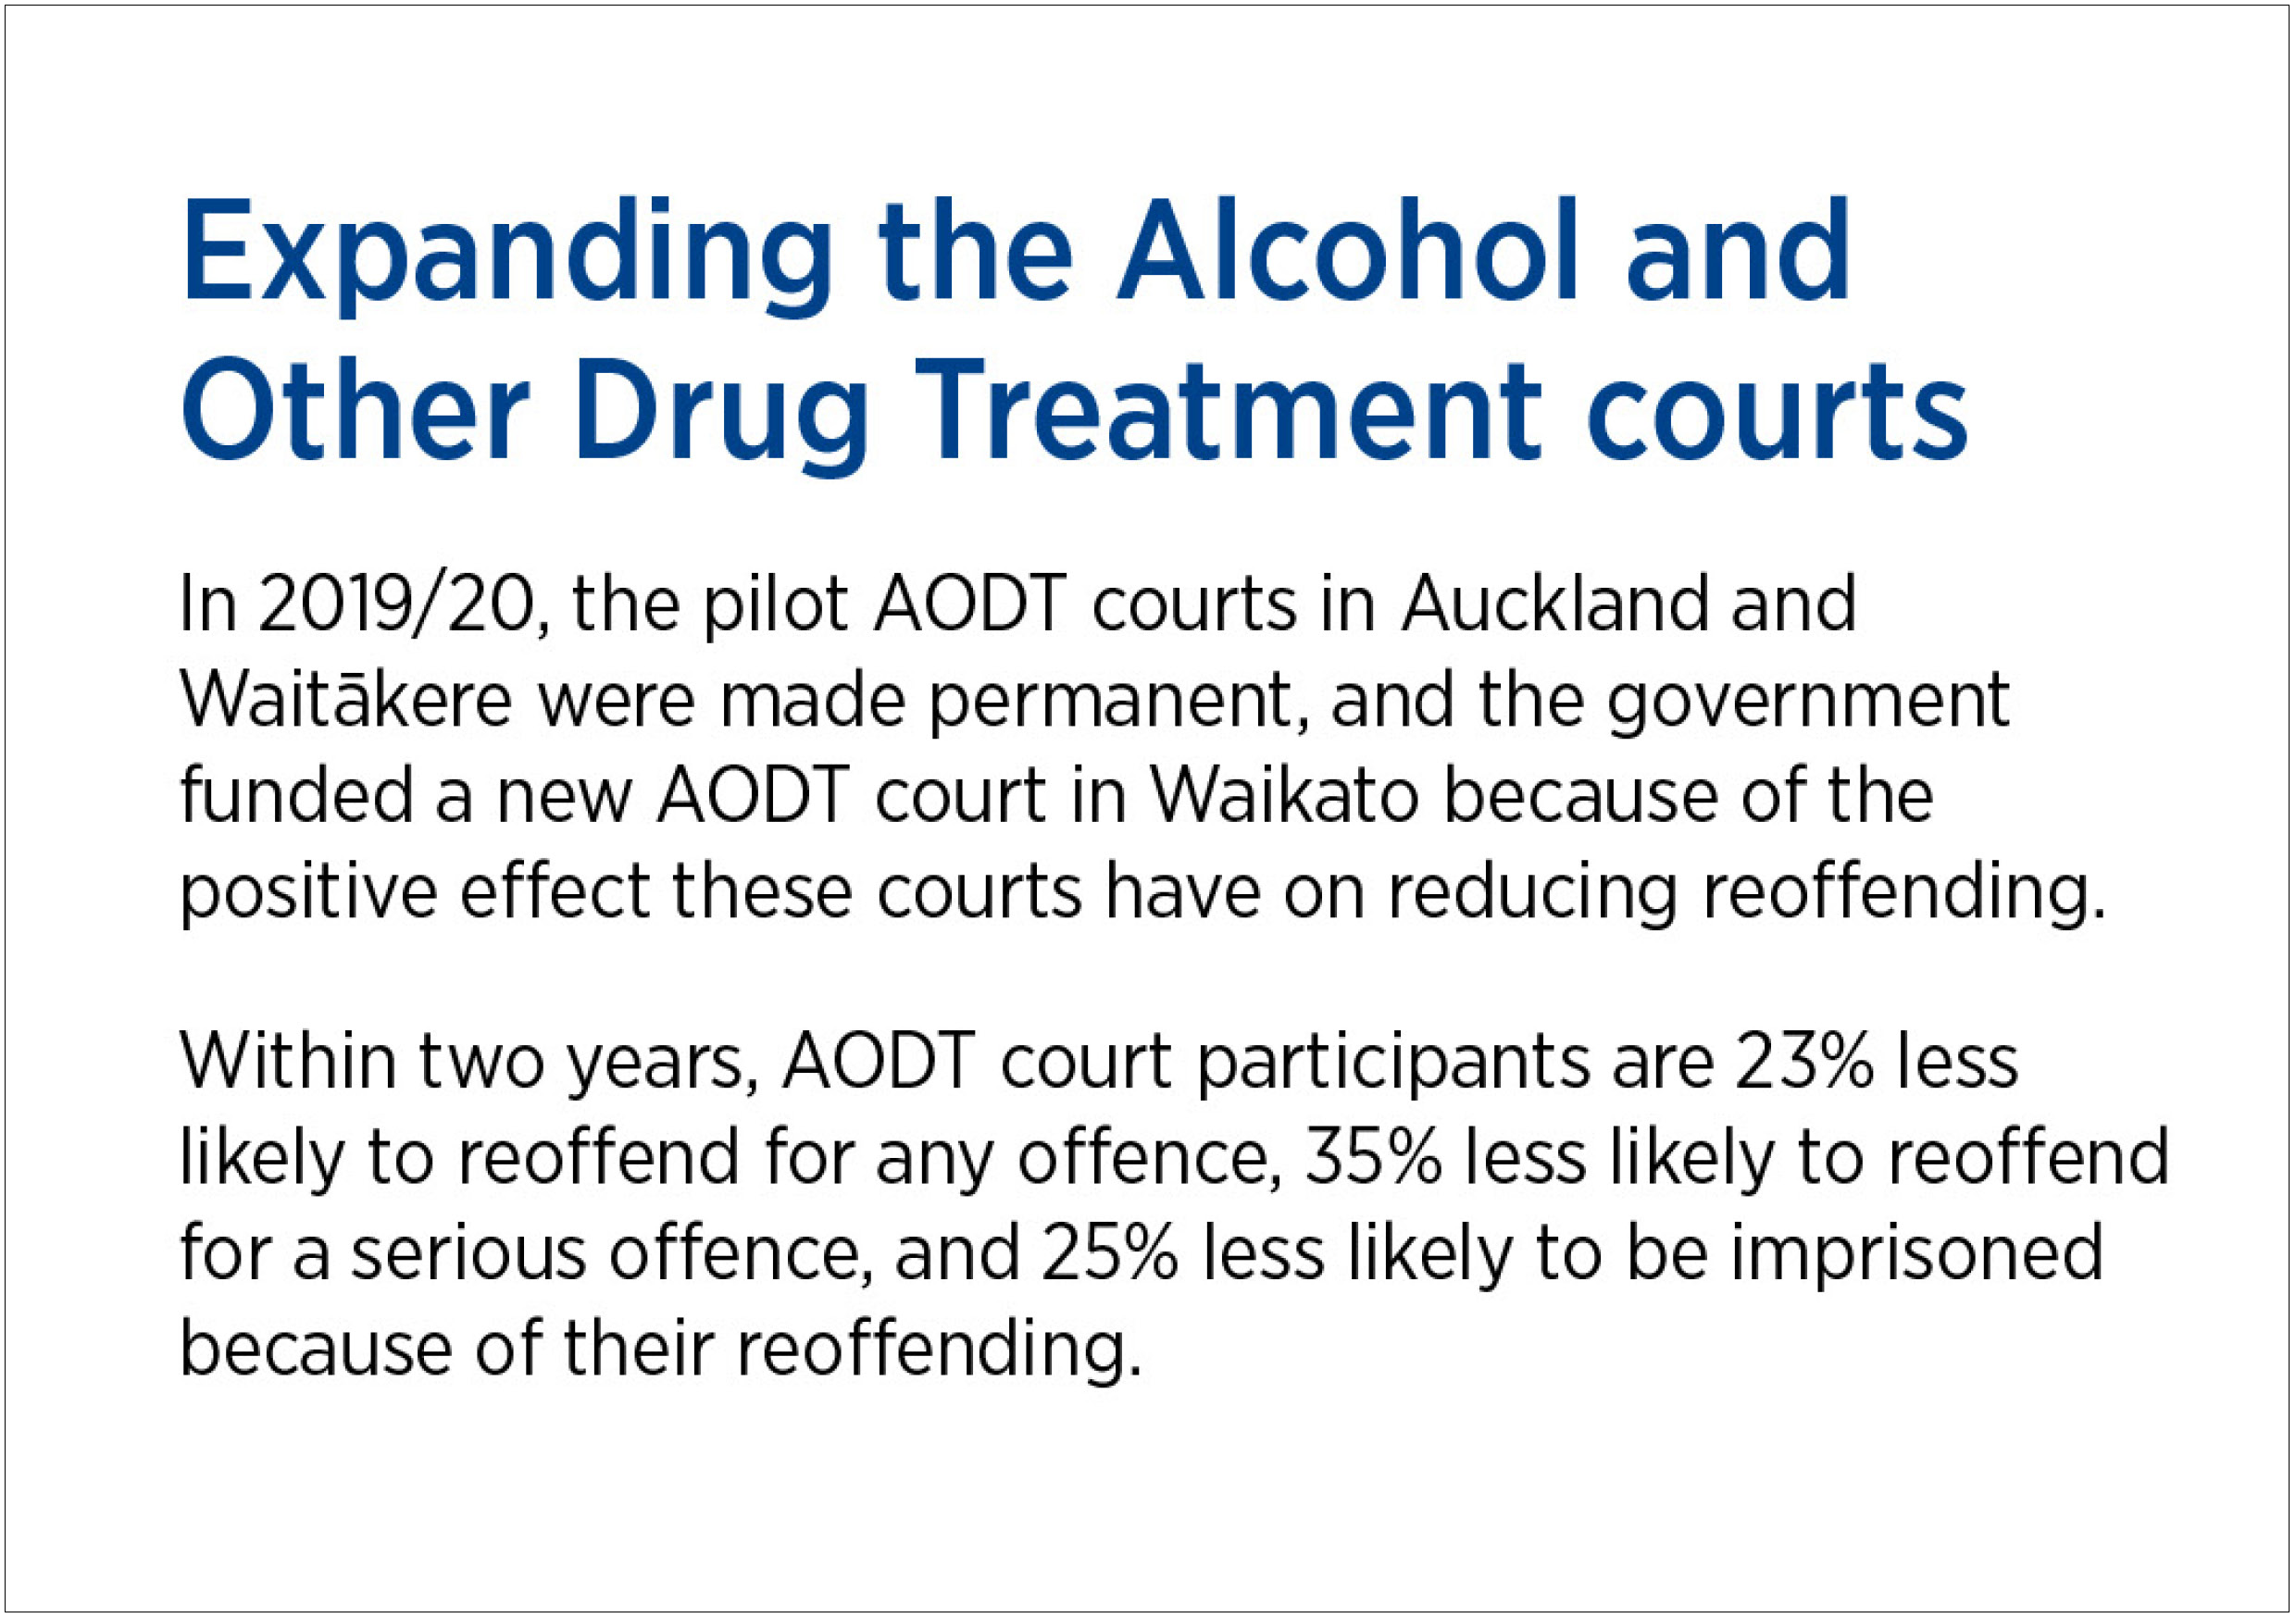
Ministry of Justice
The Ministry of Justice’s 2019/20 Annual Report includes reporting that clearly shows the impact of an aspect of its service delivery, even though it had not set out formal performance measures on this in its ex ante accountability documents.
What we liked:
- Impact is directly related to its service delivery and is meaningful to the public.
- Measures and statistics clearly demonstrate the success of the initiative.
- This information is reported even though it was not set as a formal performance measure.
