Part 2: Councils' investment in infrastructure
2.1
In this Part, we consider how councils:
- reinvested in their assets;
- reported on their three waters assets performance measures (so we could consider whether increased investment in water assets has translated into improved performance);18
- delivered on their 2020/21 capital expenditure budgets; and
- built assets needed for growth.
2.2
Because councils generally use debt to fund capital expenditure, we also consider:
2.3
In our analysis, we considered the local government sector as a whole.19 In some instances, we considered the following five sub-sectors:
- metropolitan councils;
- Auckland Council (considered separately from other metropolitan councils because of its size);
- provincial councils;
- regional councils; and
- rural councils.
2.4
Appendix 1 categorises the councils under each sub-sector.
2.5
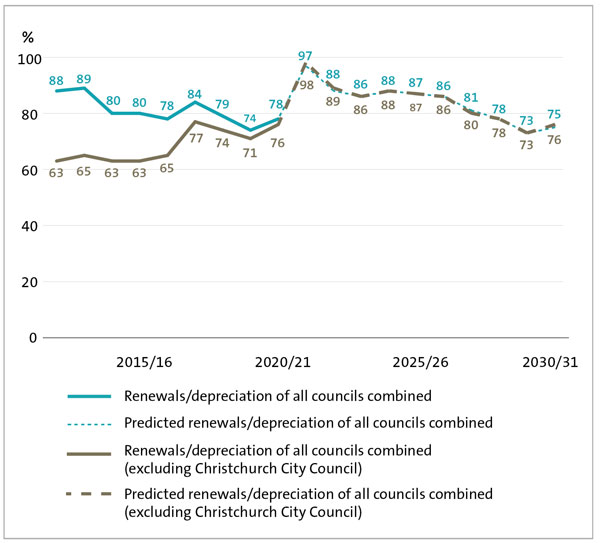
Since 2012/13, we have been reporting that councils are not adequately reinvesting in their assets. In 2020/21, councils' renewal related capital expenditure throughout the sector was 78% of depreciation for the year.
2.6
This is a slight improvement on the 74% achieved for 2019/20. However, it remains significantly less than 100%, which indicates that assets are not being replaced at the same rate as they are being used up. In 2020/21, councils spent $0.8 billion (12%) less than they planned to on their assets.
2.7
Many councils acknowledged in their 2021-31 long-term plans that they have been under-investing in their assets, particularly assets related to water infrastructure.20
Reinvestment in councils' assets during 2020/21
2.8
We compared capital expenditure on renewals with the annual depreciation charge to see how well councils are reinvesting in their assets. We consider depreciation to be the best estimate of the portion of the asset that was "used up" during the financial year. Assets have long life cycles, so this is only one indicator of whether councils are reinvesting enough.21
2.9
If councils underinvest in their assets, there is a bigger risk of asset failure and a resulting reduction in service levels. This will affect services delivered to the community. Overall, based on our analysis of the 2020/21 results, we remain concerned that councils might not be reinvesting enough in critical assets. However, forecasts for the period of the 2021-31 long-term plans indicate that councils are progressively addressing this situation.
2.10
In 2020/21, the combined renewal capital expenditure of all councils was 78% of the depreciation expense throughout the sector (this was 74% in 2019/20). This means that, for every $1 of assets used up, councils were reinvesting 78 cents. For 26 councils, renewal capital expenditure was more than 100% of depreciation (compared with 22 councils in 2019/20).
2.11
However, about a quarter of all councils' renewal capital expenditure was 78% or less than the depreciation expense for the six-year period between 2012/13 and 2017/18. This is the case for Nelson City Council and Tauranga City Council, which were predicted to peak at 72% and 71% respectively in 2021/22. They were then predicted to track down to 48% and 26% respectively in 2030/31 (during the period of their 2021-31 long-term plans).
2.12
Queenstown Lakes District Council has a similar renewals profile, with only two years being above 78% in the 2012/13 to 2030/31 period. Where the average age of infrastructure assets is low, it is expected that the need for assets renewals will be less than for older infrastructure.
2.13
Figure 9 compares actual renewal capital expenditure with depreciation for all councils, from 2012/13 to 2020/21. It also shows the predicted renewal capital expenditure for the period of the 2021-31 long-term plans. There are two lines on the graph: one that includes all councils, and one that excludes Christchurch City Council.
2.14
Christchurch City Council's renewal capital expenditure has been proportionately higher than other councils because of the rebuilding it has done since the 2011 Canterbury earthquakes. However, the impact of this has been decreasing over time. After 2020/21, it appears that this difference will no longer be notable (in Figure 9, this is the point where the lines converge).
Figure 9
Renewal capital expenditure compared with depreciation for all councils, actual percentages for 2012/13 to 2020/21 and predicted percentages for 2021/22 to 2030/31
Source: Analysed from information collected from councils' annual reports and 2021-31 long-term plans.
2.15
Between 2012/13 and 2020/21, renewals have ranged between 74% and 89% of the depreciation expense for all councils. Our analysis of councils' 2021-31 long-term plans shows that there is an expected step change in 2021/22 when councils' renewal investment is forecast to increase to 97%. However, this is then forecast to steadily decline to 73% in 2029/30.
2.16
Most councils prepared their 2021-31 long-term plans based on the assumption that territorial local authorities would continue to own water assets and provide water services to their communities. However, in November 2022, the Water Services Entities Bill had its second reading in Parliament, indicating that territorial local authorities will not have water assets on their balance sheets from 1 July 2024. The third reading of the Bill is expected in December 2022.
2.17
In the past, we have found that renewals spending as a proportion of the depreciation expense is lower for three waters infrastructure than for other infrastructure (such as roading and footpaths). Therefore, the profile and performance of councils' renewals spending as a proportion of depreciation could look quite different if three waters assets are transferred from councils to water services entities.
2.18
In 2020/21, three waters assets accounted for about 32% of councils' total renewals spending and 48% of councils' renewals spending on infrastructure.
2.19
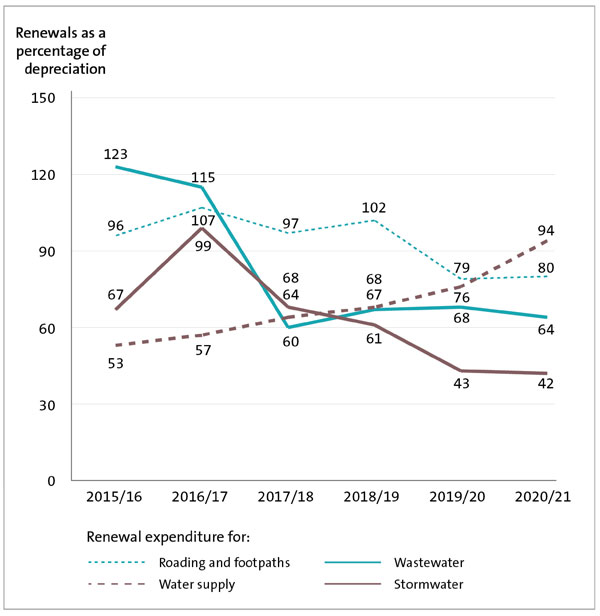
Comparing councils' 2020/21 renewals expenditure as a proportion of the depreciation expense by infrastructure asset category (see Figure 10), we can see that renewals spending on:
- roading and footpaths was 80% of depreciation;
- water supply was 94% of depreciation;
- wastewater was 64% of depreciation; and
- stormwater was 42% of depreciation.
2.20
These percentages are broadly consistent with what we saw in 2019/20. However, the percentage for water supply has increased from 76% in 2019/20 to 94% in 2020/21. This is likely to be in response to widely publicised issues with water infrastructure age and condition and associated issues with water quality.
2.21
There could also be a tendency for councils to prioritise water supply and wastewater over stormwater, particularly as there are other options to manage stormwater depending on local geography (for example, through discharge to land).
2.22
Comparing councils' 2020/21 actual renewals expenditure as a proportion of the renewals budget, we can see that renewals spending on:
- roading and footpaths was 101% of the $733.9 million budget;
- water supply was 103% of the $324.6 million budget;
- wastewater was 71% of the $419.6 million budget; and
- stormwater was 114% of the $69.3 million budget.
Figure 10
Renewal capital expenditure compared with depreciation for all councils combined by infrastructure asset category, 2015/16 to 2020/21
Source: Analysed from information collected from councils' annual reports.
2.23
The results are consistent with what we saw for renewals spending as a proportion of the depreciation expense, in that the spending as a proportion of budget was higher for water supply, and roading and footpaths, than wastewater.
2.24
However, in this case, performance was better for stormwater than wastewater, and wastewater was the only area where actual spending was less than budget (noting that the budget for wastewater was six times higher than the budget for stormwater).
2.25
Although spending on renewals is less than the annual depreciation charge and the total capital expenditure is less than budget (at 60%), councils have increased capital expenditure on their three waters assets overall.
2.26
In 2020/21, councils invested nearly $2.0 billion in three waters assets throughout the sector (see Figure 11). This is 53% of total council spending on infrastructure assets for the year and an increase of $283.9 million (17%) from 2019/20. Although this is smaller than the $385.6 million (29%) increase we saw between 2018/19 and 2019/20, it reflects the overall trend of increasing focus and reinvestment in three waters assets in recent years.
Figure 11
Spending on three waters assets as a proportion of other infrastructure assets, by capital expenditure type, 2020/21
| Capital expenditure | Three waters assets $million | Total spending on infrastructure assets $million | Percentage of total infrastructure spending on three waters assets |
|---|---|---|---|
| Meet additional demand | 758.1 | 1,041.2 | 72.8 |
| Improve the level of service | 527.8 | 1,219.6 | 43.3 |
| Renew existing assets | 704.2 | 1,475.3 | 47.7 |
| Total | 1,990.1 (2019/20: 1,706.2) |
3,736.1 (2019/20: 3,154.2) |
53.3 (2019/20: 54.1) |
Source: Analysed from information collected from councils' annual reports.
2.27
We expect this trend to continue in the short term while councils continue to own three waters assets and provide three waters services.
2.28
The 2021-31 long-term plans had a particular focus on reinvestment in three waters assets within a significant proposed capital expenditure programme of $77.2 billion throughout the sector for the next 10 years.22
Three waters performance measures
2.29
Under the Non-Financial Performance Measures Rules 2013 provided by the Secretary for Local Government, councils are required to report their performance against specific performance measures for three waters. The Department of Internal Affairs' website provides an outline of these measures.23
2.30
These measures are reported as either "achieved" or "not achieved" in councils' annual reports. We have combined the responses from all councils to see what percentage of each of the measures was reported as "achieved". This helps form a picture of which performance measures are generally being met, and which are not, across the country. In some cases, councils did not report whether they met a particular measure. In those cases, we considered the information to be "not reported". Importantly, this analysis does not take account of the size of the population within each council boundary. Therefore, the results should not be considered to reflect council performance for the population of New Zealand as a whole.
2.31
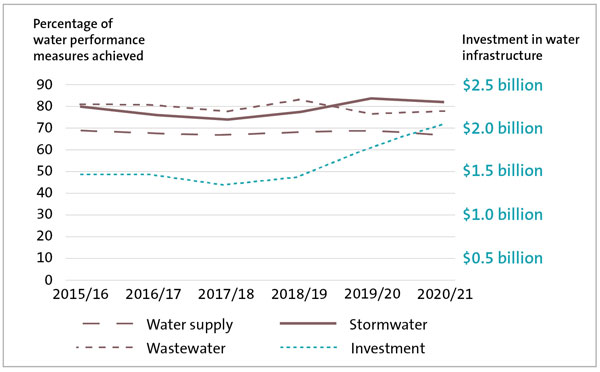
At an aggregate level, the performance against the three waters measures has been relatively consistent over the past five years (see Figure 12). Despite the increased investment in three waters assets in recent years (see paragraph 2.26), we have not seen an improvement in reported performance.24 There is also a degree of variability when we look at performance against the individual performance measures in each category. The following provides a breakdown of each of the three waters performance measures for 2020/21 for all councils reporting on these measures.
Water supply
2.32
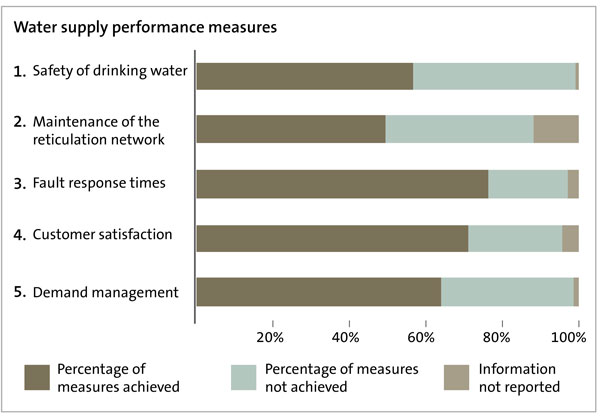
Overall, 66.3% of water supply measures in 2020/21 could be considered "achieved", which is a slight decrease from last year (2019/20: 68.5%). Figure 13 shows each measure in this category for 2020/21.
2.33
The lowest performance was for the "safety of drinking water" measure (56.7% of safe drinking water measures were achieved) and the "maintenance of the reticulation network" measure (49.5% of maintenance measures were achieved).
Figure 12
Percentage of water supply, wastewater, and stormwater performance measures achieved, 2015/16 to 2020/21, compared to the level of investment in three waters assets
Source: Analysed from information collected from councils' annual reports.
2.34
The drinking water measures show the extent to which a council's drinking water supply complies with:
- part 4 of the drinking-water standards (bacteria compliance criteria); and
- part 5 of the drinking-water standards (protozoal compliance criteria).
2.35
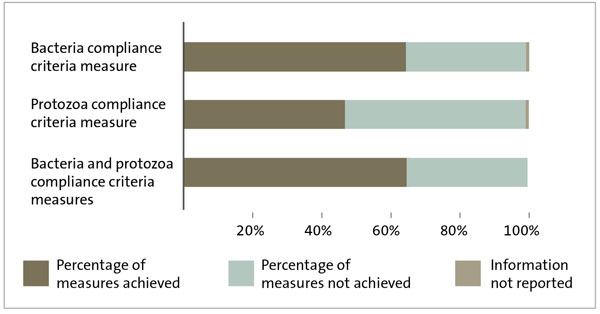
Figure 14 shows councils' performance against the safety of drinking water measures by each standard assessed within this (some councils combine these safety measures into one).25 Overall, 46.7% of the protozoal compliance criteria measures and 64.3% of the bacteria compliance criteria measures were achieved (where these two measures have been combined, 65% were achieved).
2.36
The overall result for protozoa for all councils is affected by the results of provincial and rural councils (when we look at these councils as separate groups, 50% of provincial councils and 31.7% of rural councils achieved this standard).
Figure 13
Percentage of water supply performance measures achieved in 2020/21 for all councils combined
Source: Analysed from information collected from councils' annual reports.
Note: "Information not reported" refers to circumstances where councils did not report whether they met a particular measure.
Figure 14
Percentage of drinking water measures achieved (part of the "safety of drinking water" measures), 2020/21
Source: Analysed from information collected from councils' annual reports.
Note: "Information not reported" refers to circumstances where councils did not report whether they met a particular measure.
2.37
It is important to note that where drinking water measures are "not achieved", this does not necessarily mean there is an issue with water quality or that the water is unsafe to drink. There are various reasons why a council might not be fully compliant with the Drinking Water Standards New Zealand, as each standard contains multiple criteria. For example, where continuous monitoring of the water is required, a council might be non-compliant if it could not demonstrate this or if data were missing for a short period of time. This reason for non-compliance would not necessarily mean there were any issues with water quality.
2.38
We would encourage councils that have reported their bacteria and/or protozoa measures as "not achieved" to investigate the reasons for non-compliance and prioritise remedial actions, particularly where this might affect water quality.
2.39
The drinking water standards changed in November 2022. Councils will need to ensure that they are compliant with the new standards and continue to work with Taumata Arowai as the drinking water regulator.
Wastewater
2.40
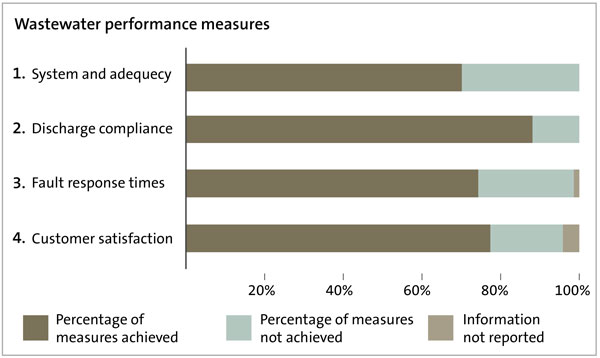
Overall, 78% of wastewater measures were considered "achieved" in 2020/21, which was largely consistent with last year (2019/20: 76.6%). Figure 15 shows each measure in this category in 2020/21.
2.41
Councils did not perform as well against the "system adequacy" measure (70.2% of system adequacy measures were achieved) and "fault response times" measure (74.3% of fault response time measures were achieved).
2.42
It appears that the performance against the "system adequacy" measure is mainly affected by metropolitan councils (excluding Auckland Council). As a group, only 45.5% of metropolitan councils achieved this measure.
Stormwater
2.43
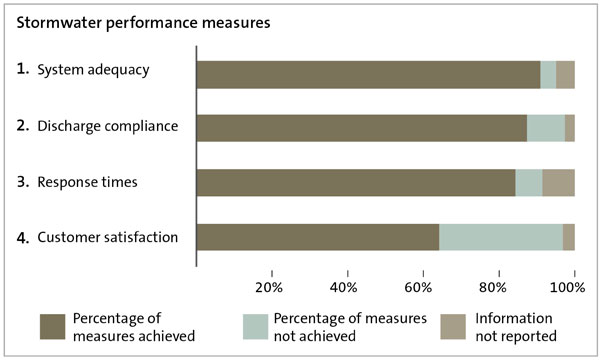
Overall, 82% of stormwater measures were considered "achieved" in 2020/21, which is consistent with last year and is the strongest area of performance against the three waters measures (2019/20: 83.6%). Figure 16 shows each measure in this category in 2020/21.
2.44
The poorest performance in this category was against the "customer satisfaction" measure (64.2% of customer satisfaction measures were achieved). It appears that this was mainly affected by rural councils – as a group, only 57.1% of rural councils achieved this measure.
Figure 15
Percentage of wastewater performance measures achieved in 2020/21 for all councils combined
Source: Analysed from information collected from councils' annual reports.
Note: "Information not reported" refers to circumstances where councils did not report whether they met a particular measure.
Figure 16
Percentage of stormwater performance measures achieved in 2020/21 for all councils combined
Source: Analysed from information collected from councils' annual reports.
Note: "Information not reported" refers to circumstances where councils did not report whether they met a particular measure.
2.45
Overall, performance against the three waters measures remains largely consistent with the previous five years (as shown in Figure 12). However, there are areas for improvement, and results can vary between urban and rural councils.
2.46
The results for 2020/21 highlight that lifting councils' performance against water supply measures should be a priority for the whole sector. Specifically, those councils that are reporting "not achieved" against the mandatory drinking water standards should prioritise actions to support performance improvements.
2.47
The historic underinvestment in three waters infrastructure might have contributed to overall performance. However, we were encouraged in our recent report on the 2021-31 long-term plans26 to note councils are now planning to spend more on renewing their water supply networks compared to forecast depreciation.
2.48
For example, forecast renewals for water supply networks have lifted from an average of 82% of depreciation during the 10 years of the 2018-28 long-term plans to an average of 122% of depreciation during the 10 years of the 2021-31 long-term plans.
Delivery of capital expenditure programmes
2.49
In 2019/20, we reported that most councils did not deliver all of their capital expenditure programmes.27 The 2020/21 results show that this has continued. As a result, some capital projects are either delayed or not being delivered at all, which could affect the levels of service that communities receive in the future.
2.50
Councils' total capital expenditure in 2020/21 was $5.80 billion, which was the highest amount councils spent on their assets in the last nine years. The amount spent was 88% of the $6.58 billion budgeted.28 However, this was the largest spending as a proportion of budget in the last nine years and an increase from 79% in 2019/20.
2.51
In our recent report on the 2021-31 long-term plans,29 we observed that a tight labour market and supply chain challenges are causing capacity issues. This creates risks to current service delivery, the delivery of future capital projects, and ultimately their cost.
2.52
There might also be a backlog of projects that were put on hold during Covid-19 lockdowns. Some councils might also have decided to defer individual capital projects to manage budgetary pressures (noting that some councils' capital expenditure was over budget – see Figure 17).
2.53
On average, all council sub-sectors spent less than 100% of their capital expenditure budgets. As was also the case in 2019/20, the regional council sub-sector was the lowest, spending $155 million or, on average, 68% of their budget. By comparison, Auckland Council spent $2.05 billion or 95% of its capital expenditure budget.
2.54
Looking at individual councils, 28 councils spent less than 80% of their capital expenditure budgets. This is a change in the pattern we have seen since 2012/13 (see Figure 17). Twenty-four fewer councils spent less than 80% of budget than in 2019/20 (in the previous eight years, the highest number in this category was 52 councils in 2019/20).
2.55
This indicates that, overall, councils are pushing to deliver their capital expenditure programmes, despite the challenges resulting from the Covid-19 pandemic. These challenges include a backlog of projects and constraints in the availability of contractors, specialists, and associated resources in New Zealand.
Figure 17
Number of councils spending less than 80%, between 80% and 100%, or more than 100% of their budgeted capital expenditure, 2012/13 to 2020/21
| Spent less than 80% of budget | Spent 80%-100% of budget | Spent over 100% of budget | |
|---|---|---|---|
| 2012/13 | 46 | 22 | 10 |
| 2013/14 | 44 | 21 | 13 |
| 2014/15 | 46 | 21 | 11 |
| 2015/16 | 45 | 20 | 13 |
| 2016/17 | 47 | 19 | 12 |
| 2017/18 | 35 | 23 | 20 |
| 2018/19 | 40 | 20 | 18 |
| 2019/20 | 52 | 13 | 13 |
| 2020/21 | 28 | 24 | 25 |
Source: Analysed from information collected from councils' annual reports.
2.56
In our report on the 2021-31 long-term plans,30 we found that councils are moving to address historical underinvestment in their infrastructure. The long-term plans had a richer discussion of the implications of previous decisions for investing in assets and what this meant for the future. Councils are forecasting to invest more in their assets than in previous long-term plans. Assuming councils can substantially deliver this planned investment, this is a positive change. Historically, this has not been the case.
Investing in assets needed for growth
2.57
Some councils are experiencing significant population growth. We consider high-growth councils to be those defined as "Tier 1 local authorities" under the National Policy Statement on Urban Development 2020, which came into effect on 20 August 2020 (see Appendix 1).
2.58
Population growth is a key assumption underlying councils' long-term plans. Councils, particularly those with high growth, need to consider the impact of this on increased demands on their infrastructure and plan to invest in their assets accordingly. We saw evidence of this in councils' 2021-31 long-term plans.31
2.59
This is the third year we have examined how well high-growth councils have achieved their growth-related capital budgets.32 In 2020/21, we found that most of these councils did not build all the assets they had budgeted for. This was also the case in 2018/19 and 2019/20. We encourage high-growth councils to reassess their future planned budgets to accommodate what they have not achieved to date.
2.60
In 2020/21, high-growth councils spent about $1.14 billion (2019/20: $1.04 billion) on capital expenditure intended to meet additional demand. This was 84% of the $1.35 billion budgeted in 2020/21 for this purpose. Three councils spent more than their growth-related capital expenditure budgets. In contrast, four councils spent less than 50% of their budgets.
2.61
High-growth councils might not have been able to complete their capital programmes for the same reasons as other councils (see paragraphs 2.51 to 2.52).
2.62
We note that some councils revised their growth forecasts in their 2021-31 long-term plans, either because growth has not been as high as expected or because higher-than-forecast growth has occurred.33 Therefore, the definition and impacts of "high growth" could apply to different councils in the future.
Council debt trends
2.63
Councils generally use debt to fund capital expenditure, which is consistent with the intergenerational nature of many of the sector's assets. The total amount of budgeted debt for all councils for the year ended 30 June 2021 was $22.56 billion. The actual total debt was $20.56 billion, which was $2 billion, or 9%, less than budgeted. The 9% lower-than-anticipated debt is consistent with the lower-than-anticipated capital expenditure (see paragraph 2.50).
2.64
We considered Auckland Council's debt separately from other councils because it accounted for 52% of the total debt for all councils as at 30 June 2021. Auckland Council had $10.69 billion of debt as at 30 June 2021, which was $352 million less than budget.
2.65
In its annual report, Auckland Council reported that borrowings were less than planned because of stronger operating cash inflows and less capital expenditure than anticipated.34 For all other councils, the total amount of debt as at 30 June 2021 was $9.87 billion, compared with a budget of $11.52 billion.
2.66
Although actual total debt for all councils (including Auckland Council) was less than budget, this was still $910.1 million, or 5%, more than actual total debt for the year ended 30 June 2020. Our report on the 2021-31 long-term plans indicated that increasing council debt is a trend we expect to see continue during the next 10 years.35 However, this will largely depend on the three waters reform programme.
2.67
With a significant increase in infrastructure investment being forecast, debt is forecast to be more than $38 billion by the end of the long-term plan period in 2031. By comparison, in their previous (2018-28) long-term plans, councils had forecast that debt would peak at about $25 billion.
Council hedging practices
2.68
Hedging is designed to protect councils against changes in interest rates and currency exchange rates. It includes the use of financial instruments such as derivatives.36 For example, to reduce interest rate risk, a council could use interest rate hedging (that is, entering into a contract for a fixed interest rate over a set period of time) to provide certainty over what its interest payments will be during that time. Even if interest rates rise, the council will continue to pay the rate agreed in the contract. This helps to provide certainty to ratepayers that councils are managing the interest rate and currency risks on their debt.
2.69
It is increasingly common for councils to adopt hedging practices to reduce interest rate and currency risks to their borrowing and investments. For example, Auckland Council has used several different types of derivatives to help mitigate risks associated with foreign currency and interest rate fluctuations that affect its debt for several years now.
2.70
As we noted in our report on our audits of councils' 2021-31 long-term plans, given increasing interest rates, councils with significant debt levels need to closely monitor interest costs and ensure that their treasury management policies and practices are appropriate.37
2.71
As more councils adopt hedging practices, we expect them to establish good governance for their treasury management practices. This includes the role of audit and risk committees and treasury management steering groups (including the use of independent experts) to provide oversight of treasury management strategy, policy, and implementation.
2.72
Councils should also ensure that they seek appropriate independent advice and carry out detailed assessments to derive fair values for any hedging instrument used.
18: The three waters are drinking water supply, wastewater, and stormwater.
19: For 2020/21, we included draft financial information for Ōpōtiki District Council in our analysis because the audit of the financial information was not complete when we carried out our analysis. Chatham Islands Council was excluded from our analysis because it will have its 2020/21 and 2021/22 annual reports audited simultaneously in 2023, so its financial information was not available when we carried out our analysis. These delays were mostly because of the auditor shortage in New Zealand.
20: Office of the Auditor-General (2022), Matters arising from our audits of the 2021-31 long-term plans, page 4 and Part 4.
21: Our comparison of depreciation with renewals is used as an indicator only. We would expect any difference between the two to reduce over the life of an asset. Also, where there is high growth, a higher proportion of capital expenditure is on non-renewal assets. Therefore, as a percentage of depreciation, renewals will trend down over time as non-renewal assets are capitalised.
22: Office of the Auditor-General (2022), Matters arising from our audits of the 2021-31 long-term plans, page 4.
23: See dia.govt.nz.
24: Our comparison of investment against performance measures is an indicator only. Although increased investment might allow for improvements in performance, it is not a direct causal relationship. There might also be a time lag between increased investment and an improvement in performance.
25: These are Nelson City Council, Ōpōtiki District Council, Waitaki District Council, Western Bay of Plenty District Council, and Westland District Council.
26: Office of the Auditor-General (2022), Matters arising from our audits of the 2021-31 long-term plans.
27: Office of the Auditor-General (2021), Insights into local government: 2020, Part 2.
28: This information is from the statement of cash flows of councils. It includes only the amount that councils spent on purchasing property, plant, and equipment, and intangible assets.
29: Office of the Auditor-General (2022), Matters arising from our audits of the 2021-31 long-term plans, page 5.
30: Office of the Auditor-General (2022), Matters arising from our audits of the 2021-31 long-term plans, pages 4-5.
31: Office of the Auditor-General (2022), Matters arising from our audits of the 2021-31 long-term plans, pages 44-45.
32: There are 18 councils in Tier 1. However, for the purposes of our analysis, we have excluded the four regional councils in Tier 1 (Waikato, Bay of Plenty, Greater Wellington, and Canterbury) because none had high growth throughout their entire region.
33: Office of the Auditor-General (2022), Matters arising from our audits of the 2021-31 long-term plans, page 44.
34: Auckland Council (2021), Auckland Council Annual Report 2020/21, Volume 3, page 56.
35: Office of the Auditor-General (2022), Matters arising from our audits of the 2021-31 long-term plans, pages 5 and 26.
36: A derivative is a contract between two or more parties which uses an underlying asset as security. For example, property could be used as security for a loan.
37: Office of the Auditor-General (2022), Matters arising from our audits of the 2021-31 long-term plans, page 6.

