Part 1: Councils' performance in 2020/21
1.1
In this Part, we consider the performance of councils in 2020/21 based on the information in councils' annual reports.1 We look at:
- the revenue recorded by councils;
- the operating expenditure of councils;
- processing times for building consents;
- processing times for resource consents; and
- the impact of the Covid-19 pandemic.
1.2
Councils produced their 2020/21 annual plans in early 2020. At the same time, Covid-19 was spreading globally and the first Covid-19 cases were emerging in New Zealand. Because this was a highly uncertain time, councils were generally conservative when setting their budgets.
1.3
However, the economy performed better than expected in 2020/21. This is reflected in councils' overall financial performance. Revenue recorded by councils (from rates, subsidies, grants, and other revenue) was 11% higher than budgeted. Operating expenditure incurred by councils was in line with what had been budgeted for.
1.4
A record number of building consents was processed during 2020/21, including an increase in complex multi-unit consents. Despite this we observed only a marginal decline in the timeliness of processing building consents. High demand, the increasing complexity of consents, a tight labour market, and Covid-19 restrictions affected the time frames for processing consents.
1.5
Councils processed resource consents in similar time frames to 2019/20. However, we noted a significant increase in councils using extended time limits. As with building consents, the increased volume of activity and the tight labour market were reasons councils commonly provided for not meeting the statutory time frames.
1.6
The Government established the Covid-19 Response and Recovery Fund in April 2020.2 However, we were unable to tell how much funding was received throughout the sector – or how this funding had been used – because there is no requirement for councils to report this information. We have identified six good practice examples of particular councils proactively and transparently reporting this information (see paragraphs 1.66 to 1.72).
Revenue recorded by councils
1.7
Councils recorded total revenue of $15.0 billion for 2020/21. This was 11% higher than the $13.6 billion budgeted. Excluding Auckland Council, councils recorded total revenue of $9.7 billion, which was 23% higher than councils had forecast ($8.5 billion).
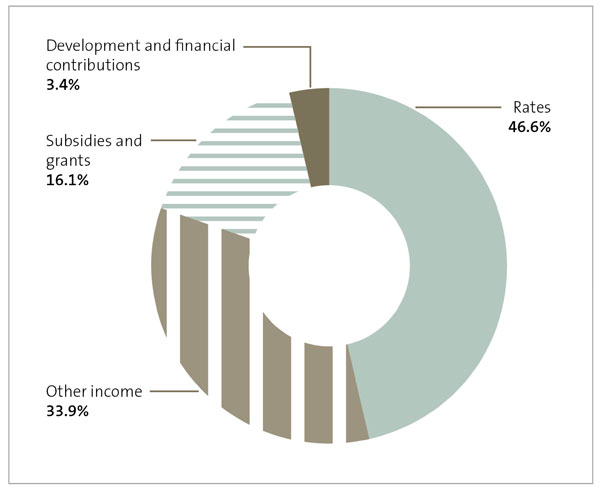
Figure 1
Councils' 2020/21 actual revenue by sub-category
Source: Analysed from information collected from councils' annual reports.
1.8
The composition of revenue recognised by councils did not change significantly from the previous financial year.
1.9
Of the total revenue in 2020/21, $7.1 billion was from rates. This was consistent with the amount councils planned to collect in rates and equates to 46.6% of the councils' total revenue (see Figure 1). In 2019/20, rates were 47.6% of councils' total revenue.
1.10
The revenue from development and financial contributions was $119 million (31%) higher than budgeted.3 This increase reflects the growth that many councils are facing.
1.11
For example, Central Hawke's Bay District Council's development and financial contributions revenue was up significantly (301%) compared to budget. The Council faced significant growth and development in the district and saw unprecedented resource and building consent numbers for new dwellings.
1.12
The Council's view was that some of this activity was due to developers reacting to the price rises signalled in the draft Development Contributions Policy (which was being consulted on as part of its 2021-31 long-term plan) and acting ahead of the changes to minimum lot sizes signalled in its draft District Plan (which was also under consultation).
1.13
Christchurch City Council's development and financial contributions revenue also increased significantly (203%) compared to budget. This was attributed to increased building activity.
1.14
Auckland Council received an additional $89 million in development and financial contributions (an increase of 65% compared to budget). This was mainly because of new housing built by large-scale developers.
1.15
The increase in development and financial contributions could reflect that some councils are reviewing development-related revenue streams to address historic underinvestment in infrastructure and the associated affordability challenges that the required additional investment creates for their communities.
1.16
Some councils introduced new development contributions policies to help reduce the financial burden on existing ratepayers. Some councils are investing in development. This created a need for development contributions policies, which is reflected in increased revenue from this source.
1.17
Other income was $977 million (24%) higher than planned. Other income includes fees and charges, gains on sale of land, regional fuel tax, and gains on disposal and vested assets. Fuel tax received was higher than planned, mainly because more fuel was used than anticipated.
1.18
Overall, subsidies and grants revenue throughout the sector increased by 16% compared to budget. This reflects the additional funding that the Government made available in response to the Covid-19 pandemic (see paragraph 1.61).
1.19
As an example, Ashburton District Council received subsidies and grants of more than $7 million (194%) higher than budget. The Council received $2 million from the Provincial Growth Fund as part of a $20 million total contribution towards the new library and civic centre building.
1.20
Ashburton District Council also received nearly $4 million of grants from the Department of Internal Affairs as part of the three waters stimulus funding, which it applied to the Ashburton Relief Sewer Project. The Council had not budgeted for this in its 2020/21 annual plan.
Operating expenditure of councils
1.21
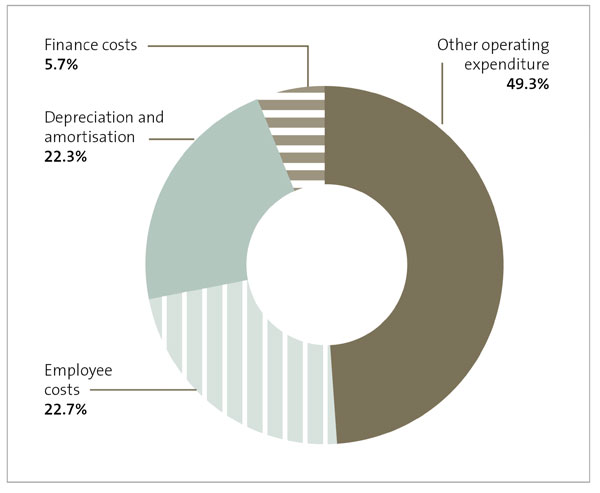
Councils incurred higher than forecast operating expenditure. The total operating expenditure for all councils was $12.8 billion, which was a $307 million (2%) increase from the planned expenditure of $12.5 billion. When Auckland Council is excluded from these results, councils incurred total operating expenditure of $8.24 billion compared with a budget of $8.0 billion. Figures 2 and 3 show a breakdown of expenditure by sub-category.
Figure 2
Councils' 2020/21 actual operating expenditure by sub-category
Source: Analysed from information collected from councils' annual reports.
Figure 3
Councils' 2020/21 actual and budget operating expenditure by sub-category
| Operating expenditure | 2020/21 actual $million | 2020/21 budget $million | Expense as a proportion of total actual operating expenditure (%) |
|---|---|---|---|
| Depreciation and amortisation | 2,860.6 | 2,843.1 | 22.3 |
| Employee costs | 2,906.3 | 2,838.6 | 22.7 |
| Finance costs | 725.1 | 825.6 | 5.7 |
| Other operating expenditure | 6,316.5 | 5,994.0 | 49.3 |
| Total | 12,808.3 | 12,501.2 | 100.0 |
Source: Analysed from information collected from councils' annual reports.
1.22
Employee costs for all councils increased by 2% to $2.9 billion compared to a budget of $2.8 billion. Provincial and regional councils spent more on employee costs than budgeted (4% and 11% respectively). Spending was close to budget for all other council sub-categories. Changes in staff numbers and salaries have contributed to increased employee costs.
1.23
In our report Insights into local government: 2020, we noted a 3.2% increase in employee costs compared to budget. We also noted that we often heard about councils' challenges in recruiting and retaining skilled staff, particularly regulatory and engineering staff.
1.24
We are still hearing this in our regular engagement with councils, and the results show that this is having more of an impact in the provinces. However, many other sectors are also experiencing increased employee costs as a result of the tight labour market.
1.25
Other operating expenditure – including grants, professional and contract costs, IT, insurance premiums, utilities, and rental expenses – was up 5% compared to budget. From our analysis, there was no consistent reason for this. However, the additional funding central government made available in response to the Covid-19 pandemic meant that there was more money available to spend (see paragraphs 1.18 and 1.61).
1.26
Other operating expenditure accounted for $6.3 billion, which was similar to the previous financial year and represented 49.3% of total operating expenditure, indicating that there had been little change in councils' operations. Some councils show a large "other operating expenses" balance in their annual reports, which they do not always break down into further detail.
1.27
We have noted that liabilities from leaky home claims is a long-standing issue that continues to have significant expenditure implications for some councils. We first reported on councils' exposure to liabilities from leaky home claims in our report Local government: Results of the 2006/07 audits.4
1.28
Auckland Council, Queenstown Lakes District Council, and Tauranga City Council had higher operating expenditure compared to budget because of remediation of weathertightness issues and associated building defects. These issues are complex, and the legal proceedings are at various stages. As a result of this uncertainty, it is difficult for councils to budget for these costs.
1.29
Auckland Council noted in its annual report that, because of the uncertainty about providing for remediation of weathertightness issues and associated building defect claims, these costs are not budgeted for. However, Auckland Council's provision for remediation of weathertightness claims increased by $89 million because of the high estimated costs associated with multi-unit claims.
1.30
Queenstown Lakes District Council increased its provision by $22 million to resolve several building-related legal claims against it.
1.31
Tauranga City Council's weathertightness (and other) provisions expense increased by $26 million (compared to budget) because of two significant property claims against the Council for weathertight repairs that are in various stages of legal proceedings.
1.32
Offsetting higher operating expenditure, finance costs throughout the sector were 22% lower than budgeted for. Generally, finance costs are made up of interest expenses, amounts paid or payable on borrowings and debt instruments, and net realised gains or losses.
1.33
This is consistent with our findings in Part 2. We found that council debt was not as high as forecast (see paragraph 2.63) because collectively councils delivered 88% of their capital expenditure programmes.
1.34
This also indicates that councils were more conservative as they anticipated that there might be further cashflow challenges because of the Covid-19 pandemic. We saw many examples of councils reducing their borrowing, which resulted in lower interest costs. Falling interest rates also reduced finance costs.
1.35
Finance costs were particularly low for rural councils (56% compared to budget). Some councils focused on reducing borrowing and overdraft facilities. Others experienced lower finance costs because of falling interest rates.
Processing times for building consents
1.36
Councils have a statutory requirement to process most building consent applications in 20 working days (this applies to 67 out of the 78 councils, because the 11 regional councils do not process building consent applications). Our auditors periodically look at how councils meet this requirement as part of their audit of councils' non-financial performance.
1.37
This timeliness requirement can also be used as an indicator of councils' effectiveness in responding to growth. In 2019/20, we reported that most councils did not meet the statutory time frames for processing building consent applications. This trend has continued into 2020/21.
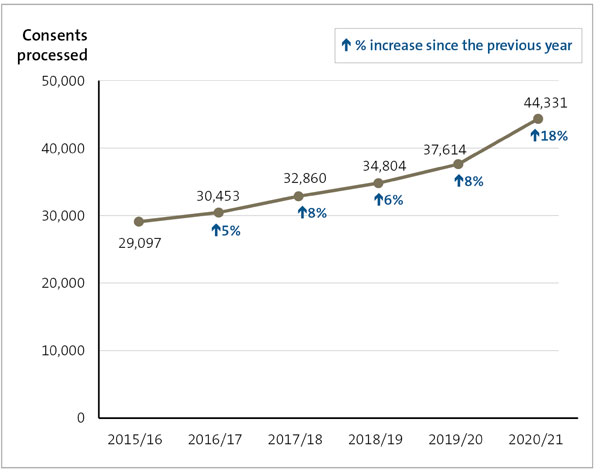
Figure 4
Total number of building consents processed for new dwellings, 2015/16 to 2020/21
Source: Analysed from information collected from councils' annual reports.
1.38
More building consent applications have been processed in 2020/21 than in any previous year. In total, 44,331 building consent applications were processed. This is an 18% increase from 2019/20 (see Figure 4). This has mainly been driven by Auckland Council, which issued a record 19,036 building consents for new dwellings in the year ended June 2021 (a 29% increase from 2019/20).5 The Auckland Council figures represent 63% of the total increase in building consents issued between 2019/20 and 2020/21.
1.39
There has also been a significant increase in the number of building consents issued for new multi-unit dwellings throughout the country – this has increased by 28% from the last financial year.6 Auckland Council is again the main contributor to this change, representing 95% of the total increase in multi-unit building consents between 2019/20 and 2020/21.
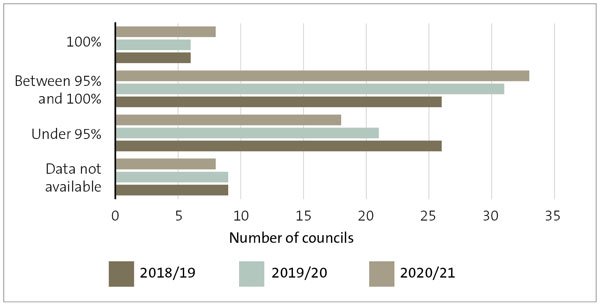
Figure 5
Percentage of building consent applications processed within 20 working days, 2018/19 to 2020/21
Source: Analysed from information collected from 67 councils' annual reports.
1.40
In 2020/21, building consent performance data was available for 58 councils. Of those, only six reported that they had processed 100% of building consent applications in 20 working days (see Figure 5), which is the statutory requirement.7 This is the same result as 2019/20.8 Twenty-six councils reported that they had processed between 95% and 100% of building consent applications within the time frame (2019/20: 31).9 The remaining 26 councils reported that they processed fewer than 95% within the time frame (2019/20: 21).10
1.41
We did not find usable information about building consent timeliness in nine councils' annual reports. This is consistent with 2019/20. These councils used alternative performance measures instead of the 20-working day requirement. Given that issuing and monitoring building consents is a core council function, we expect all councils to report their performance against the statutory time frame.
1.42
In 2020/21, the number of councils processing building consent applications within 20 working days has not changed from 2019/20. However, fewer councils are reporting that they processed between 95% and 100% of building consent applications within the 20-day time frame. This continues a declining trend since the pre-Covid results in 2018/19.
1.43
Of the six councils that processed 100% of building consent applications within the statutory time frame,11 only one (Waimakariri District Council) is classified as a Tier 1 local authority under the National Policy Statement on Urban Development 2020 (see Appendix 1). This is the same result (and council) as last year and means that most councils that are experiencing the highest growth are still not meeting the statutory time frame for processing building consent applications.
1.44
However, the performance for processing building consent applications has been affected by the increase in volume of applications, increased complexity because of the increase in multi-use dwellings, staff resourcing issues, and the Covid-19 pandemic affecting the capacity of councils to process these applications.
Processing times for resource consents
1.45
Under the Resource Management Act 1991, all councils have a statutory requirement to process resource consent applications in set time frames. Time frames depend on the type of consent.12
1.46
As part of the audit of councils' non-financial performance information, our auditors look at how councils meet this requirement. As with building consent performance, this timeliness requirement can be used as an indicator of local councils' effectiveness in responding to growth and the quality of their service delivery. Regional councils process resource consents and coastal, discharge, and water permits.
1.47
In 2020/21, resource consent performance data was included in the annual reports of 71 out of 78 councils (local, regional, and unitary). We did not find usable information about resource consent timeliness in the other seven councils' annual reports. Because issuing and monitoring resource consents is a core council function, we would expect councils to be reporting this information. For the regional council subgroup, data was available for all 11 regional councils.
1.48
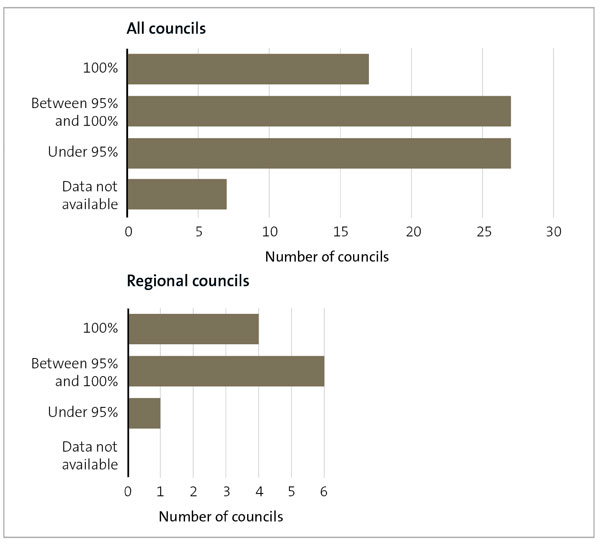
Figure 6 shows councils' performance processing resource consent applications in 2020/21. Councils consistently identified increased work volumes and planning staff resourcing issues as reasons for not achieving processing performance targets.
Figure 6
Number of councils that met the time frames for processing resource consent applications in 2020/21
Source: Analysed from information collected from councils' annual reports.
1.49
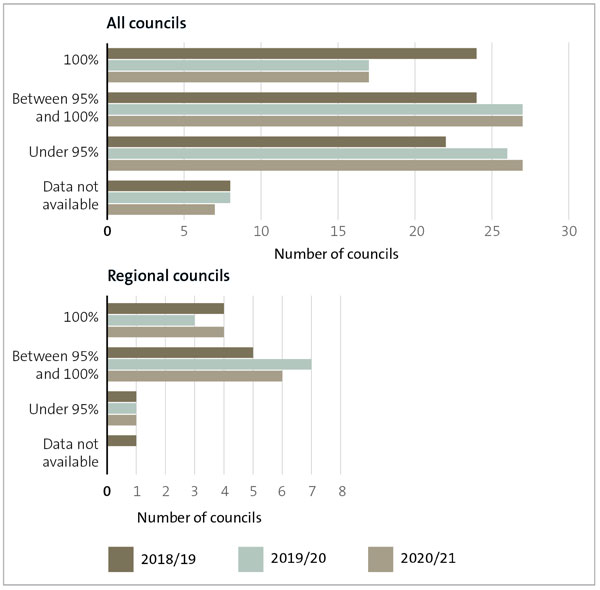
Figure 7 shows trends in timeliness for processing resource consent applications from 2018/19 to 2020/21. When all councils are combined, performance in 2020/21 is comparable to 2019/20, halting the decline seen between 2018/19 and 2019/20. For regional councils, performance was reasonably consistent during the three-year period and at a consistently higher level compared to the results for all councils.
1.50
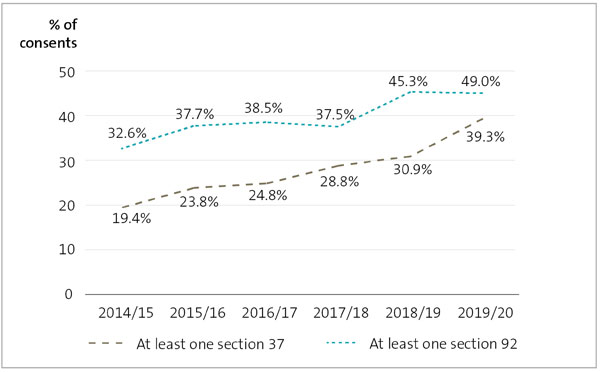
However, the Ministry for the Environment has identified a significant and increasing use by councils of section 37 of the Resource Management Act to extend the time limits for processing resource consent applications (see Figure 8).13
Figure 7
Councils' compliance with statutory time frames for processing resource consent applications between 2018/19 and 2020/21
Source: Analysed from information collected from councils' annual reports.
1.51
Of the 17 councils that processed 100% of resource consent applications in the statutory time frame, only one (Waipā District Council) is classified as a Tier 1 council under the National Policy Statement on Urban Development 2020 (see Appendix 1). No local councils identified as high growth under the previous version of the National Policy Statement achieved this result in the previous year.
1.52
Because no complete dataset for the number of resource consent applications processed by councils in 2020/21 is available, our ability to comment is limited.14 In noting the record numbers of building consent applications processed, we would expect that resource consent numbers would be higher compared to longer-term averages, particularly in areas of high growth.
1.53
However, many councils throughout the country referenced the high workloads they had experienced during the year. Fluctuations in resource consent numbers are likely to be less volatile in comparison to building consent applications, reflecting the different consenting requirements under the Resource Management and Building Acts. For example, a large-scale subdivision typically generates a higher number of building consent applications than resource consent applications.
Figure 8
Resource consents that use at least one section 92 (further information requests) or section 37 (extended time frames) in their processing, 2014/15 to 2019/20
Source: Ministry for the Environment (2021), Patterns in Resource Management Act implementation: National Monitoring System data 2014/15 to 2019/20.
1.54
There is a focus on councils' performance measures for processing resource consent applications in a timely way and that meets statutory time frames. However, performance measures relating to timeliness varied between councils, and not all councils provided an explanation when they missed their targets. It is good practice for councils to explain why they missed targets in their annual reports. We encourage them to do this.
1.55
Although about half of councils measure the timeliness of processing resource consent applications in a straightforward way, other councils variously measure:
- all resource consents;
- non-notified or other sub-categories of resource consents only; or
- timeliness against a different, non-statutory time frame.
1.56
Performance measures for monitoring, compliance, and environmental outcomes are less commonly adopted by territorial local authorities (in contrast to regional councils).15 These factors limit the transparency of councils' performance, including the effects of consenting decisions and the ability to make comparisons between councils.
1.57
We encourage councils, particularly territorial local authorities, to actively review the effectiveness of their resource consent performance measures as part of the next long-term plan process. We encourage all councils to critically evaluate their performance and seek improvements to processing times. We particularly encourage this for high-growth councils so they can effectively support growth in their communities.
The effects of the Covid-19 pandemic on council services
1.58
The Covid-19 pandemic continued to affect the country in 2020/21. However, it was a period of relative normality given much of the country was at either Alert Level 1 or Alert Level 2 (Auckland was the only region to go into Alert Level 3 during this period).
1.59
We looked at whether the performance information that councils reported indicated a decline in the levels of service they provided during 2020/21. As in 2019/20, our analysis did not indicate any significant decline in the levels of service provided by councils. Many of the services provided by councils are essential services that continued despite alert level restrictions.
1.60
Although the Covid-19 pandemic caused disruptions, councils found ways to adapt and to largely continue their services (for example, by moving services online and providing click and collect library services). The bigger disruptions seemed to come from events being cancelled because of alert level restrictions and delays to certain capital projects because of labour and materials shortages.
Funding and expenditure specific to the Covid-19 pandemic
1.61
Councils could apply for different funding initiatives through the Covid-19 Response and Recovery Fund. These initiatives included "shovel ready" funding, the Strategic Tourism Assets Protection Programme funding, Jobs for Nature, Provincial Growth Funding, and the wage subsidy scheme.
1.62
We have reported separately on several of these initiatives.16
1.63
In our Update on the Government's Covid-19 expenditure, we noted that it is complex to form a complete picture of Covid-19-related expenditure.17 We reported that it would be difficult, if not impossible, for Parliament and the public to track how the Covid-19 funding decisions (by initiative) have been assigned to the various funding authorities (appropriations) provided by Parliament.
1.64
A partial picture of Covid-19 expenditure by the local government sector can be formed by looking at individual annual reports for the amount incurred against appropriations that were set up exclusively for the Covid-19 response. However, doing this requires knowing which departments administer those appropriations and which of those appropriations authorise Covid-19-only expenditure.
1.65
There was no requirement for councils to separately report or disclose Covid-19 funding and expenditure. Therefore, we could not easily see how each council had used its funding. However, we have identified some examples of good practice where councils reported to their communities the funding they received, and how this funding was used.
1.66
Ashburton District Council received a $20 million grant towards its new library civic centre building from the Government's Covid-19 Response and Recovery Fund. Construction began in 2021, and the Council reported that it was estimated to be completed by the end of 2022. The Council also received $8 million in stimulus funding that it combined with its own contribution of $2 million to bring forward the Ashburton Relief Sewer Project.
1.67
Auckland Council reported receiving a top-up subsidy from Waka Kotahi of $86 million to keep the transport network operating, as during the financial year the number of people taking public transport remained well below what it was before the Covid-19 pandemic.
1.68
Northland Regional Council reported receiving $12.5 million to fast-track flood mitigation works in the Awanui flood scheme. This meant that the previously planned $15 million, eight-year upgrade would now be able to be delivered in 2022/23, which is earlier than planned. The Council also reported that it was able to carry out additional work – alongside its partners Far North District Council and Waka Kotahi – to make further riverside improvements.
1.69
Queenstown Lakes District Council received a contribution from the Government's "shovel ready" Covid-19 recovery programme. It used this funding to transform Queenstown's town centre and start work on the first stage of the proposed Queenstown Town Centre Arterial Road. The Council reported that this contribution recognised the importance of providing the support the community needed.
1.70
Taranaki Regional Council reported that it had received significant contributions to several of its programmes in the form of "post-Covid-19" funding. The Council's long-running Riparian Management Programme received a $5 million funding boost through the Jobs for Nature initiative. This meant that many farmers paid only $1 for each plant and hired contractors to do the planting. "Towards Predator-Free Taranaki" received a $750,000 grant from the Jobs for Nature initiative, allowing for six extra positions to be created. The Yarrow Stadium Plus redevelopment project received $20 million in government response infrastructure investment funding for repair work.
1.71
Taupō District Council received government funding of $20.6 million for the Taupō Town Centre Transformation project as part of the Covid-19 stimulus package. The project is taking place in four phases over two years. The Council received additional Covid-19 stimulus funding for street revitalisation works in Tūrangi ($6.5 million) and for paving a shared pathway alongside the East Taupō Arterial route, which will be completed over two years.
1.72
Taupō District Council also received $8.3 million, as part of the three waters funding, to bring forward necessary works to drinking and wastewater infrastructure.
1: For 2020/21, we included draft financial information for Ōpōtiki District Council in our analysis because the audit of the financial information was not complete when we carried out our analysis. Chatham Islands Council was excluded from our analysis because it will have its 2020/21 and 2021/22 annual reports audited simultaneously in 2023, so its financial information was not available when we carried out our analysis. These delays were mostly because of the auditor shortage in New Zealand.
2: The Covid-19 Response and Recovery Fund is a funding envelope for budget management purposes, rather than an actual sum of money ring-fenced in the Government's accounts. The fiscal implications of several new measures were managed against the Covid-19 Response and Recovery Fund during April and early May 2020. As at 14 May 2020, the Government had committed $29.8 billion of the Covid-19 Response and Recovery Fund, of which $13.9 billion had been announced before Budget Day as part of the Government's ongoing response to the Covid-19 pandemic.
3: Development contributions can be defined as contributions from developers, collected by the council to help fund new infrastructure required by growth as set out in the Local Government Act 2002.
4: Office of the Auditor-General (2007), Local government: Results of the 2006/07 audits.
5: Statistics New Zealand Tatauranga Aotearoa (2022), "Building consents issued: June 2022", at stats.govt.nz.
6: Multi-unit dwellings include apartments, retirement village units, townhouses, flats, and units.
7: These councils were Invercargill City Council, South Waikato District Council, Waimakariri District Council, Mackenzie District Council, Ruapehu District Council, and Waitomo District Council.
8: Note this has been updated from five in last year's published report because of a data update and the inclusion of South Wairarapa District Council.
9: This has been updated from 33 in last year's published report because of a data update.
10: This has been updated from 22 in last year's published report because of a data update.
11: Three provincial and three rural councils met the statutory time frame.
12: The time frames are 10 working days for fast-track consents, 20 working days for non-notified consents, within 20 working days after close of submissions for notified consents where no hearing is required, and within 15 working days after the hearing for notified consents where a hearing is required.
13: Ministry for the Environment (2021), Patterns in Resource Management Act implementation: National Monitoring System data 2014/15 to 2019/20, Wellington.
14: The Ministry for the Environment's annual reporting is expected to include information on numbers of Resource Management Act consents.
15: As a group, regional councils have extensive performance measures relating to their compliance and monitoring functions that are presented as core business, reflecting these councils' responsibilities to manage and report on the state of the environment.
16: Office of the Auditor-General (2021), Management of the Wage Subsidy Scheme and Implementation of recommendations – Management of the Wage Subsidy Scheme; Office of the Auditor-General (2021), Update on the Government's Covid-19 expenditure; and Office of the Auditor-General (2022), Inquiry into the Strategic Tourism Assets Protection Programme.
17: Office of the Auditor-General (2021), Update on the Government's Covid-19 expenditure.

