Part 2: Progress against our outcomes and strategic intentions
The outcomes we seek to influence are:
- Parliament and New Zealanders have trust and confidence in the public sector;
- An accountable public sector; and
- A high-performing public sector.
Our measures show that the outcomes we seek to influence were mostly maintained or improved in 2017/18. However, our environment is changing fast and there is no room for complacency. We will continue our efforts to improve the performance of, and the public's trust in the public sector.
| Outcome 1: Parliament and New Zealanders have trust and confidence in the public sector | |
|---|---|
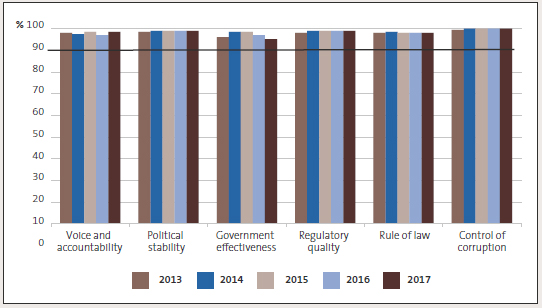
| Measure | New Zealand's ranking at or above the 90th percentile of the Worldwide Governance Indicators is improved (or at least maintained).* |
| Result | Achieved when last assessed in 2017. |
| Comment | Results for the Worldwide Governance Indicators are usually published every September for the previous calendar year. |
New Zealand's ranking in the Worldwide Governance Indicators, 2013 to 2017  |
|
| Measure | The State Services Commission's Kiwis Count Survey** shows improved (or at least maintained) rates of:
|
| Result | Achieved. |
| Comment | The Kiwis Count Survey measures New Zealanders’ trust in public services in two ways – by trust in the public service brand (perception) and by experience. New Zealanders’ trust in public services was maintained. New Zealanders’ levels of trust in the public service brand (perception) was 47% in 2017 and 45% in 2016. Since 2012, perception of trust results have varied between 41% and 47% (2016: 45%, 2015: 44%, 2014: 45%, 2013: 44%, 2012: 41%). New Zealanders’ levels of trust in public services based on experience was also maintained at 79%, the same as the 2016 result. Since 2012, trust based on experience results have varied between 75% and 81%. |
* See the World Bank website, http://info.worldbank.org/governance/wgi/.
** For survey results, see the State Services Commission website, www.ssc.govt.nz.
| Measure | New Zealand’s score on the Transparency International Corruption Perceptions Index* is improved (or at least maintained). |
| Result | Achieved. |
| Comment | In 2017, New Zealand's public sector ranked first in the world in the Transparency International Corruption Perceptions Index with a score of 8.9 out of 10. While New Zealand's public sector was ranked as the least corrupt in the world, the 2017 score was a decline from the previous three years when the New Zealand score was consistently between 9.0 and 9.1. |
* See the Transparency International website, https://www.transparency.org/news/feature/corruption_perceptions_index_2017#table.
| Outcome 2: An accountable public sector | |||||
|---|---|---|---|---|---|
| Measure | Public sector behaviour is more responsible in the area of accountability for public resources. | ||||
| Result | Achieved, based on our assessment of results for our indicators. | ||||
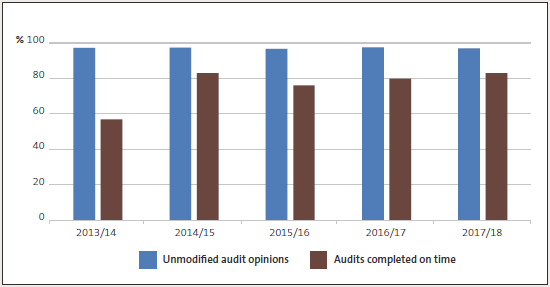
| Comment | Holding public entities accountable for their use of public resources is a fundamental part of our work. Indicators of responsible behaviour in relation to accountability for public resources include timely and reliable information, sound management, good governance, and integrity levels. Each year, we examine trends for these aspects of public sector behaviour to assess an overall outcome for this measure. These are discussed in detail below. Overall, we consider that the results for these indicators show that public sector behaviour in the area of accountability for public resources shows a similar level of responsibility to previous years. However, we observe that there is no room for complacency. Timeliness and reliability We use audits completed on time as a proxy for the timeliness of public entities in completing their financial and performance information within statutory time frames, and we use our issue of unmodified audit opinions as an indicator of the reliability of that information. This year, 83% of public entities' audit reports were signed within the statutory time frame, compared with 80% in 2016/17. We collect data about the timeliness of public release of annual reports only for local authorities. For 2016/17, 92% of local authority annual reports were publicly available on time (95% for 2015/16). The percentage of unmodified audit opinions remains relatively steady. This year, 97.0% of our audit opinions were unmodified, compared with 97.5% in 2016/17 and 96.7% in 2015/16. |
||||
Percentage of unmodified audit opinions and audits completed on time, 2013/14 to 2017/18  Sound management and good governance Results for the central government sector (excluding schools) have maintained a strong position for management control environment, financial information systems and controls, and service performance information and associated systems and controls. |
|||||
| Ratings for central government entities, 2013/14 to 2016/17 | |||||
| 2013/14 | 2014/15 | 2015/16 | 2016/17* | ||
| Management control environment | |||||
| Very good | 59% | 62% | 63% | 63% | |
| Good | 34% | 32% | 32% | 33% | |
| Needs improvement | 7% | 6% | 5% | 5% | |
| Financial information systems and controls | |||||
| Very good | 48% | 53% | 54% | 52% | |
| Good | 43% | 42% | 42% | 46% | |
| Needs improvement | 9% | 5% | 4% | 3% | |
| Service performance information and associated systems and controls | |||||
| Very good | 9% | 8% | 16% | 17% | |
| Good | 73% | 79% | 78% | 79% | |
| Needs improvement | 18% | 13% | 6% | 4% | |
| * We take a standard rounding practice approach to our calculations. Due to rounding, the 2016/17 results for Management control environment and Financial information systems and controls total 101%. | |||||
| Integrity We previously reported information from the three-yearly Integrity and Conduct Survey carried out by the State Services Commission (SSC). The SSC has not conducted the Integrity and Conduct Surveys since 2014/15 and is still working on a new approach to gathering information about integrity and conduct in the public sector. We have used an alternative indicator for assessing public sector integrity. The International Civil Service Effectiveness Index (the Index)* is a pilot project that assesses how a country's central government civil service is performing compared with others around the world. A collaborative project between the University of Oxford and the Institute for Government in the United Kingdom, the Index measures data across a range of organisational core functions and attributes. The integrity aspect of the Index measures the extent to which civil servants behave with integrity, make decisions impartially and fairly, and strive to serve both citizens and Ministers. The most recent results from 2017 show that the New Zealand public sector ranked first on integrity compared to the 30 other countries reviewed. Overall, the New Zealand public sector ranked second on the Index. While the Index is still a pilot project, the intention is to broaden its scope and expand country coverage. When the SSC produces information about integrity in the New Zealand public sector, we will consider whether to report relevant aspects of that information or continue with using the Index as an indicator of integrity in New Zealand's public sector. |
|||||
* See the University of Oxford's website: https://www.bsg.ox.ac.uk/about/partnerships/international-civil-service-effectiveness-index.
| Outcome 3: A high-performing public sector | |
|---|---|
| Measure | The State Services Commission's Kiwis Count Survey shows improved (or at least maintained) rates of service quality for all public services. |
| Result | Achieved. |
| Comment | The overall service quality score for 2017 is 76. New Zealanders' satisfaction with the quality of public services was maintained. (2016: 74, 2015: 75). Overall, service quality scores have fluctuated between 72 and 76 since 2012. |
The Auditor-General's strategic intentions to 2025
The Auditor-General's strategic intentions to 2025 describes our direction for the next eight years. This year, we prepared our Strategy, which will give effect to our strategic intentions during the next four years, and a supporting Organisation Development Plan to ensure that we are in the best possible position to deliver on our priorities.
While we have strong foundations in place, our external environment continues to change. Being able to respond to change is critical to achieving our strategic intentions. As a result, we have sharpened the focus of our Strategy to ensure that we are focused on work that will maximise our influence on positive change in the public sector. We have reprioritised our Organisation Development Plan to ensure that we have the capability, systems, and organisational culture we need to support our future work.
We intend to monitor progress against our Strategic Intentions and gauge the impact that we are aiming for. We will report on that when we have made further progress.

