Part 2: What is understood about Māori student achievement
2.1
In this Part, we show how we used the data we obtained from the Ministry and ERO.
2.2
We used this data to carry out some descriptive analysis and statistical tests about Māori students' achievement, participation, and engagement.
2.3
The descriptive analysis shows large variability in achievement for Māori students who attend similar schools. Our analysis led us to look at which factors might relate to the achievement of Māori students.
Summary
2.4
By using information provided by the Ministry, the education sector can gain a clearer understanding of the issues affecting Māori students' achievement.
2.5
Māori educational achievement is improving over time, but the results for Māori students from roughly similar communities who are being educated in roughly similar settings and circumstances vary markedly.
2.6
Our visits to schools highlighted the wide variation in how schools use information. We saw a high correlation between schools using information effectively and better Māori student achievement.
2.7
Although not all data collected is readily accessible, it can be used to ask important questions and inform decisions about resourcing, quality of teaching, and how schools use information. We were not able to analyse softer information because this information is unavailable at the aggregate level.
2.8
We also found that many of the schools operating in the most challenging circumstances had the least experienced leaders. It is important that new principals and teaching staff receive enough ongoing support and mentoring to help them do their job well.
2.9
Our work indicates that there could be better use of, and different ways of viewing, information to improve decision-making and outcomes for Māori students.
The education sector understands the importance of having good information
2.10
It is important that people are able to understand and use the information the education system produces. The Ministry publishes information so that parents, students, whānau, and communities can improve their understanding about the education system and, in particular, outcomes for Māori students:
The public availability of a range of information is intended to build understanding of the progress and achievement of students at all levels of the education system, and to focus attention on where there is limited progress or barriers to achievement. Good quality information will provide the basis for communities, families, parents and whānau to engage and collaborate with schools and kura, and with other local stakeholders to support the achievement of their students.9
2.11
Schools take a "teaching as inquiry" approach. The Ministry describes this approach as one where teachers look into what is most important to help an individual student learn, what approaches are most likely to help that student learn, and what happens as a result of that teaching.
The schools Māori students attend
2.12
We looked at enrolment data from the Ministry to understand the context of Māori students in schools.
2.13
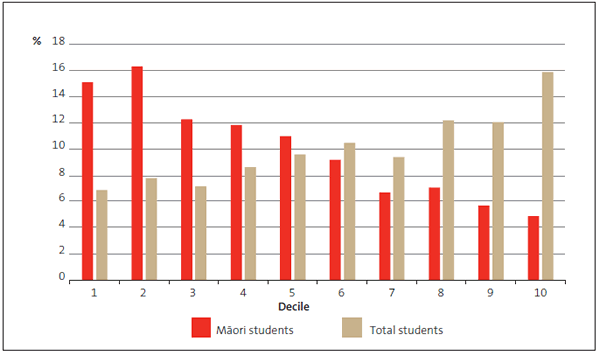
Figure 1 shows that Māori students are heavily concentrated in low-decile schools compared with the total school population.
Figure 1
Distribution of Māori students by school decile, as at July 2014
Source: Data from the Ministry of Education, Education Counts, School Directory July 2014.
2.14
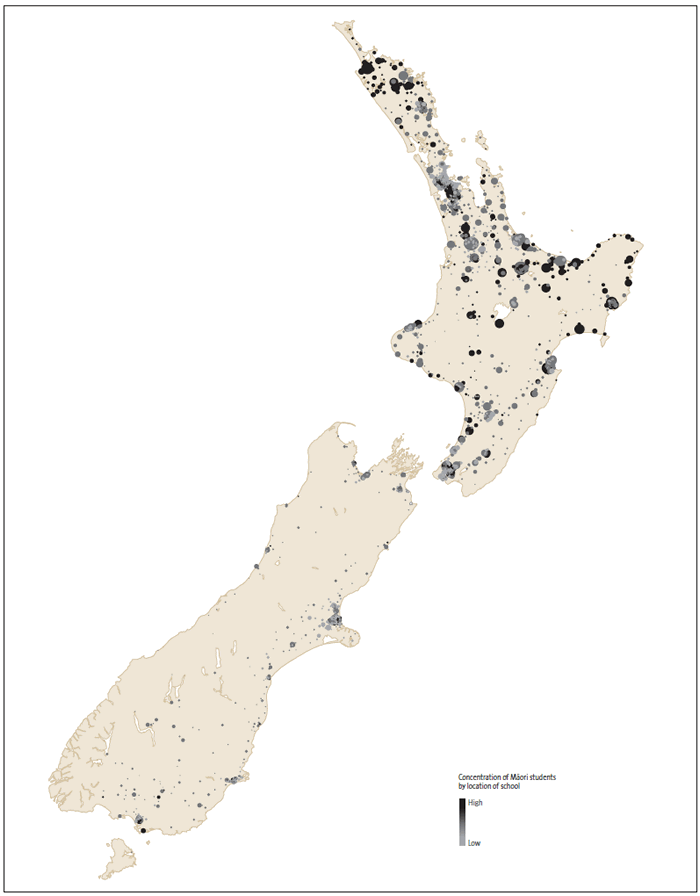
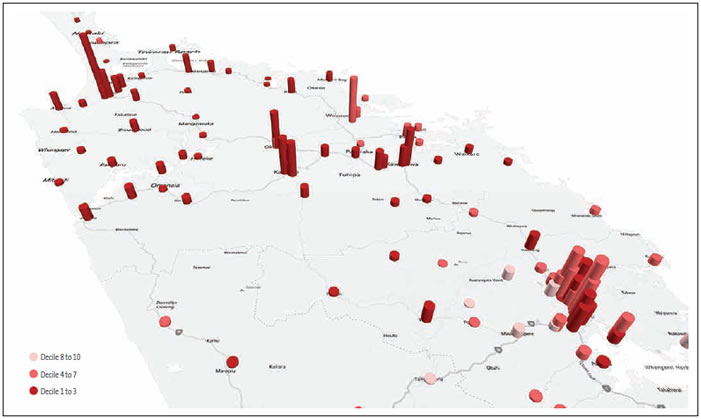
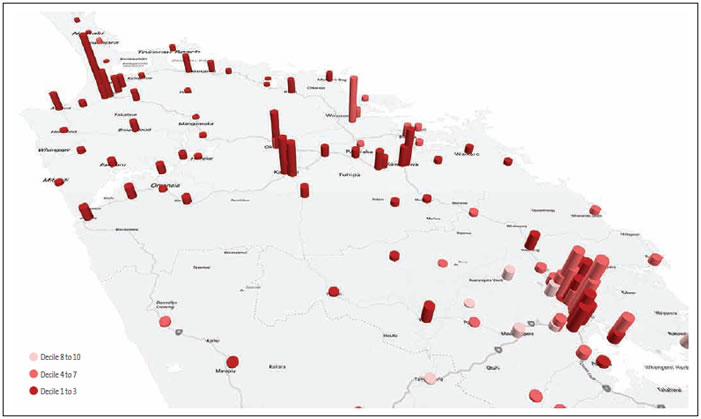
Figure 2 shows that Māori students are geographically widely dispersed and highly concentrated in certain localities. This is more clearly illustrated in Figure 3, where we show greater detail for two particular regions – Northland, a semi-rural region, and Auckland, a large city region.
Figure 2
Distribution of Māori students by school (excluding Te Aho o Te Kura Pounamu – the Correspondence School)
Source: Data from the Ministry of Education, Education Counts, School Directory May 2015.
Figure 3
Number of Māori students, by school and decile, in the Northland and Auckland regions
Source: Data from the Ministry of Education, Education Counts, School Directory May 2015.
2.15
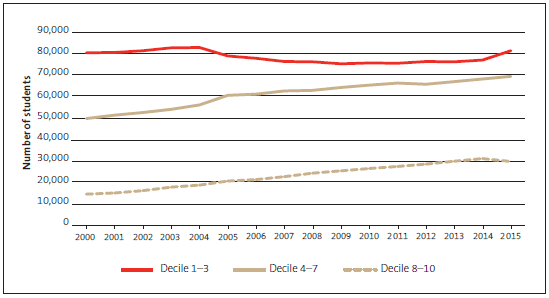
Figure 4 shows that the Māori rolls in medium-decile and high-decile schools are growing.
Figure 4
Number of Māori students in schools as at 1 July, 2000 to 2015
Source: Ministry of Education, Education Counts, Student Roll by School Decile.
Māori student achievement
2.16
Māori educational achievement is improving over time in absolute terms and relative to non-Māori educational achievement. However, the results for Māori students from roughly similar communities who are being educated in roughly similar settings and circumstances vary markedly.
2.17
This implies that many Māori students have poorer educational outcomes than their peers in similar schools and communities. This is likely to have life-long effects on the life choices and employment options available to those students. In our view, addressing this variation in educational success is essential for New Zealand's future.
2.18
Primary schools (years 1 to 8) use National Standards to assess educational progress. National Standards were introduced in 2010. Although they are not a qualification, they set clear expectations for reading, writing, and mathematics that students need to meet.
2.19
At secondary school, the main qualification is NCEA. This is obtained through a combination of internal and external assessments. There are three levels to NCEA at secondary school level. In practice, these three levels correspond to years 11, 12, and 13 of teaching for many students.
2.20
One of the three goals that the Ministry is responsible for under the Better Public Services (BPS) programme is that, in 2017, 85% of 18-year-olds will have achieved NCEA Level 2 or an equivalent qualification.10
2.21
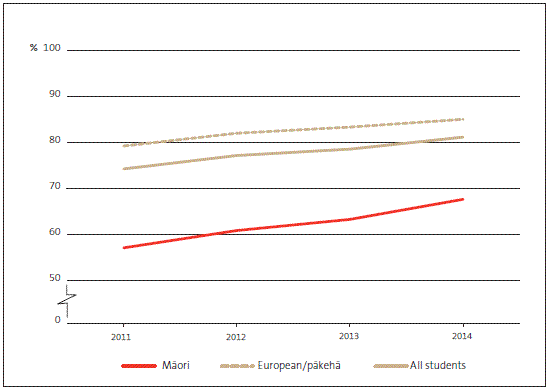
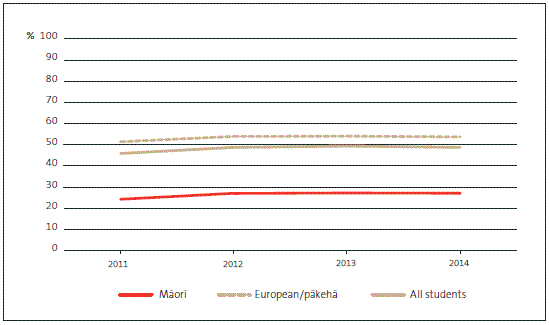
Figures 5 and 6 show that Māori students' achievement of NCEA Levels 2 and 3 are, on average, lower than that of other students. However, the difference in achievement is reducing over time.
Figure 5
Percentage of 18-year-olds who achieved a minimum of NCEA Level 2 or equivalent, by ethnic group, 2011 to 2014
Source: Ministry of Education, Education Counts 2015.
Figure 6
School leavers with NCEA Level 3 and above, by ethnic group, 2011 to 2014
Source: Ministry of Education, Education Counts 2015.
The kind of schools Māori students attend is related to achievement
2.22
Using the Ministry's data, we explored whether similar schools achieved similar results for Māori students.
2.23
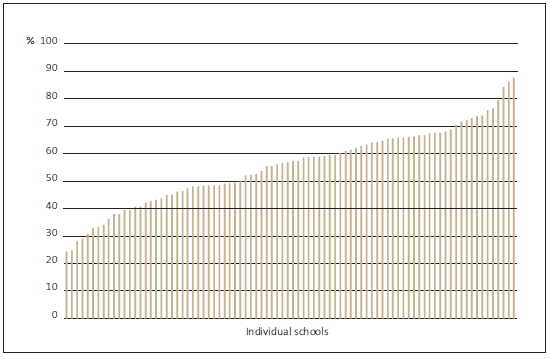
Figure 7 shows that the proportion of Māori students at or above the National Standards average for maths, reading, and writing is more than three times higher in the best-performing decile 1 small primary school compared with the poorest-performing decile 1 small primary school.
Figure 7
Percentage of Māori students at or above the National Standards average, decile 1 small primary schools, 2014
Source: Our analysis of the Ministry of Education's National Standards data. We have excluded schools with fewer than 30 Māori students.
2.24
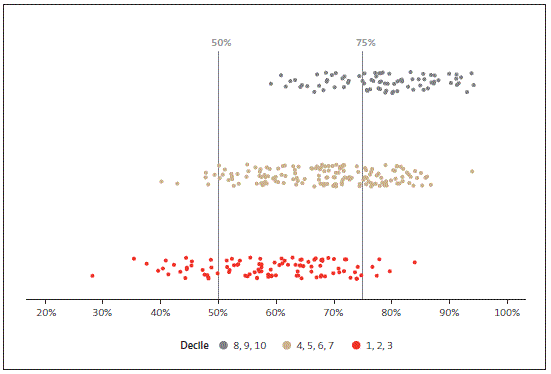
Figure 8 shows the variability in National Standards results for Māori students between similar-decile medium primary schools in 2014.
Figure 8
Variability in National Standards results for Māori students, medium primary schools, 2014
Source: Our analysis of the Ministry of Education's National Standards data. We have excluded schools with fewer than 30 Māori students.
2.25
We did the same analysis using NCEA Level 2 results for Māori students and reached similar conclusions.
2.26
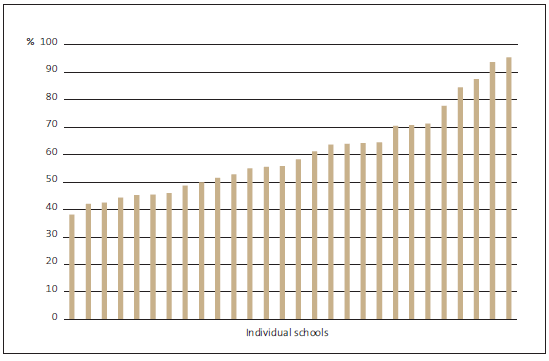
Figure 9 shows that the proportion of Māori students at or above average NCEA Level 2 results is almost three times higher in the best-performing decile 2 small secondary school than in the lower-performing decile 2 small secondary school.
Figure 9
Percentage of Māori students at or above average NCEA Level 2 results, decile 2 small secondary schools, 2014
Source: Our analysis of the Ministry of Education's NCEA data. We have excluded schools with fewer than 30 Māori students.
2.27
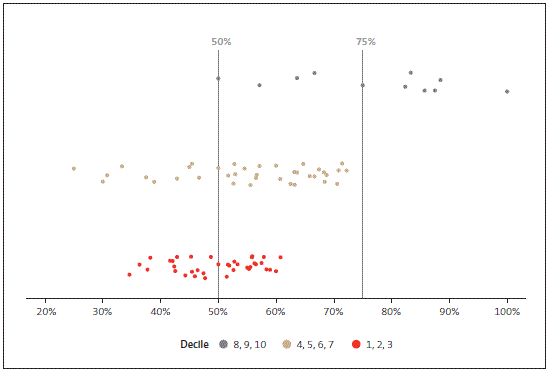
Figure 10 shows the variability in NCEA Level 2 results for Māori students between similar-decile small secondary schools in 2014.
Figure 10
Variability in NCEA Level 2 results for Māori students, small secondary schools, 2014
Source: Our analysis of the Ministry of Education's NCEA data. We have excluded schools with fewer than 30 Māori students.
2.28
Although many factors are related to achievement, it is clear that there is a link between the school a Māori student attends and their achievement. Appendix 3 further shows this disparity for a range of school sizes, types, and deciles.
Positive and negative factors influencing success
2.29
Our school visits gave us insight into the factors that might influence Māori students' achievement. We visited 13 schools throughout the country. Of those 13 schools, 10 schools were similar in decile, type, and size but had different levels of Māori achievement.
2.30
We found that schools that use information better had more experienced leadership and capability.
2.31
We also found that many of the schools operating in the most challenging circumstances had the least experienced leaders. To show the different approaches schools take, we asked some schools we visited whether they set separate achievement targets for Māori students. Some schools did and some did not. There could be possible links between the schools' approach and the differences in Māori student achievement. Figure 11 sets out what we found helps and hinders schools to use information effectively to support Māori students' success.
Figure 11
What helps and hinders schools to use information to support Māori student achievement
| What helps | What hinders |
|---|---|
| Information technology that makes it easy to integrate and share multiple information sources. Experienced principals. Active questioning of achievement data by the school's board of trustees. Critical mass of teachers able to investigate and comprehend achievement data. Teachers as a group examining achievement data because it encourages robust discussion of the issues. A clear inquiry cycle focused on improvement. Acknowledgement in a school's strategic documents of the importance of using information to improve education outcomes. Providing information to whānau about the progress and achievement of Māori students within a school. Coherent professional planning and mentoring support for staff to use the "teaching as inquiry" approach. Teachers willing, and having the disposition, to reflect on their own teaching information. |
Challenges in getting information about incoming students and the success of students after they leave a school, in part because student management systems are not aligned. Lack of confidence in the consistency of overall teacher judgements. Small numbers of Māori students in some schools, making trend and comparative analysis between years difficult. School's board of trustees does not take an active interest in discussions about student achievement information. Inability of some student management systems to support different levels of access to information about a student. High levels of transient students. No access to historical student results when using some assessment tools (this is related to ownership of the unique student identifier and associated information). |
Source: Our school visits.
Using information well raises questions and identifies opportunities
2.32
The data about Māori student achievement, participation, and engagement held by the Ministry is useful for raising questions and stimulating discussion about Māori student achievement. It can help identify opportunities for performance improvement.
Our approach to analysing Ministry data
2.33
To explore Māori students' achievement, we asked the Ministry for a range of achievement, engagement, participation, and administrative data.
2.34
We tested factors that we considered were related to our three measures of Māori student achievement (see paragraph 2.37). Our analysis is exploratory and descriptive. It examines whether there is a relationship between the factor and student achievement. The testing does not show the strength of the relationship.
2.35
We looked at three broad areas of administrative data and categorised them under:
- school management;
- school capability; and
- school characteristics.
2.36
We did not include cost information or data that supports the measurement of Māori succeeding as Māori because of its limited availability. We explain this later in the report.
2.37
We used the following as measures of Māori student achievement:
- the proportion of Māori students at a school who were "at or above" National Standards (as an average of reading, writing, and maths);
- the proportion of those "at or above" NCEA Level 2; and
- the proportion of Māori students who stayed at school until they were aged 17.
2.38
We did not look at Ngā Whanaketanga Rumaki Māori results. We excluded schools with fewer than 30 Māori students to remove sharp variability in achievement rates.
2.39
Our analysis is not intended to provide conclusive proof of the factors that determine Māori student achievement. Rather, we intend this analysis to start conversations about the school-related factors that may relate to Māori student achievement.
2.40
This analysis does not take into account the variability and strength of the relationship between the school-related factors and Māori student achievement. Our analysis is intended to provide a different lens to view how this information can be used.
Our analysis relates some factors to Māori student achievement
2.41
Figure 12 summarises the relationships we found between selected school-related factors and Māori student achievement. Against each school-related factor, we show whether our analysis found that Māori student achievement varied against what would have been expected from what the statistical analysis predicted (see Appendix 2).
2.42
These results led us to ask more questions about the relationship between the school attended and Māori student achievement.
Has the education sector got the distribution of skill and experience right?
2.43
As shown in Figure 12, our analysis found that Māori students were doing better in schools where the principal had been in the job for longer and the turnover of staff was lower. This raises questions about whether the sorts of schools that Māori students attend have the same level of experience among their principals and whether the staff turnover is similar to other schools.
Does the proportion of Māori students in a school matter?
2.44
Our analysis indicates that, in schools with a high proportion of Māori students, Māori achievement is more likely to be worse than in a school with a low proportion of Māori students. This again raises questions about whether the schools with higher proportions of Māori students are getting the right support they need to help improve Māori student achievement. This excludes the Māori immersion schools that follow Ngā Whanaketanga Rumaki Māori.
Figure 12
School-related factors and Māori student achievement against NCEA Level 2, National Standards, and length of time at school
| School-related factors | Māori student achievement is ... | |||
|---|---|---|---|---|
| better than expected | mixed | worse than expected | ||
| Management | Financial difficulty |  |
||
| Larger working capital |  |
|||
| Larger operating surplus |  |
|||
| Larger public equity |  |
|||
| Larger operating grant |  |
|||
| Larger spend on professional development |  |
|||
| Not under statutory intervention |  |
|||
| Capability | Satisfactory ERO reviews |  |
||
| Longer principal tenure |  |
|||
| Lower staff turnover rate |  |
|||
| Participates in Positive Behaviour for Learning programmes |  |
|||
| Participates in Achievement, Retention, and Transition programmes |  |
|||
| Characteristics | Higher proportion of Māori students |  |
||
| State-integrated school |  |
|||
| Has an enrolment scheme* |  |
|||
Source: Our analysis of the Ministry of Education's data.
* School enrolment schemes or school zoning is a means of preventing overcrowding at a school, by limiting enrolment mainly to students who live in the school area (zone).
Has the education sector got the distribution of resources right?
2.45
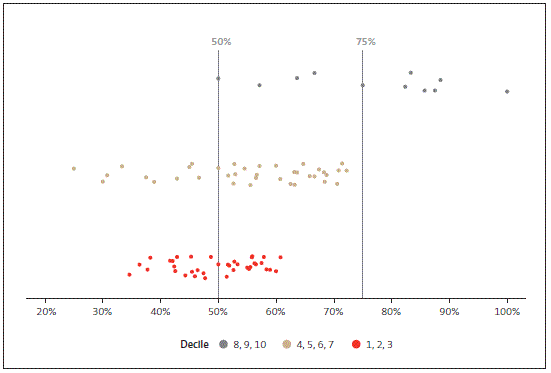
Figure 13 shows that Māori students attend mostly small schools. This raises questions about whether, overall, Māori students are accessing the same range of experiences (for example, those provided by specialist teachers and guidance counsellors) that are more likely to be available in larger schools. Our analysis showed that 75% of all decile 1-3 schools are small. Although small schools offer many benefits, there are fewer teachers to share the burden of, for example, disruptive behaviour.
Figure 13
Percentage of students' ethnicity by school size
Source: Our analysis of the Ministry of Education's data.
2.46
We did not see many consistent relationships with the financial factors we selected. However, there is a relationship between Māori student achievement and whether a school is in financial difficulty, and whether a school has a large operating grant (the budget for running the school). This might suggest that how schools manage their finances is more important than how much funding they receive. This raises questions about a potential link between good financial management and student achievement.
Is the quality of teaching interactions with Māori students understood well enough?
2.47
It was not possible to work out whether there are differences in the quality of teaching engagement that Māori students receive, compared with others. Each school should understand how its teachers are engaging with their students, but information about teaching engagement does not exist at an education-system level.
2.48
We recognise that getting this information would be challenging. However, it is important to understand whether Māori students receive similar engagement and quality of teaching to other students.
2.49
This lack of information also raises questions about whether Māori students are getting appropriate engagement and quality of teaching that supports their cultural needs. This is important for Māori students to achieve as Māori.
Using information well contributes to success
Schools that use information better achieve better outcomes for Māori students
2.50
We looked at contrasting pairs of schools to assess whether the way each school used information made a difference. The pairs were of similar size, type, and decile. Each pair consisted of one high-scoring and one low-scoring school based on the performance of Māori students in NCEA Level 2 or National Standards.
2.51
In the schools we visited, we saw a high correlation between the school using information effectively and higher Māori student achievement. We observed several common attributes of schools using information effectively. These are:
- an intense focus on using information to change processes;
- managing and using information about individual students; and
- monitoring the relationship between the school, students, and whānau.
2.52
Schools we assessed as using information effectively were:
- setting strategic goals;
- measuring the school's performance;
- building relationships with, and working hard to understand, their students and the wider community;
- exhibiting a culture of inquiry and challenge; and
- asking how all of this relates to achievement.
2.53
Our observations are consistent with what ERO found in the same schools. Our analysis also indicates in Figure 12 that ERO is appropriately focusing its resources through school reviews, as the better performing schools have less frequent reviews. Figure 14 shows some of ERO's review comments about the schools we visited. These comments support our observation that using information well supports student achievement.
Figure 14
Education Review Office's review comments about the schools we visited
| Schools we visited that had a large percentage of Māori students at or above NCEA Level 2 or National Standards | Schools we visited that had a small percentage of Māori students at or above NCEA Level 2 or National Standards |
|---|---|
| Medium secondary: "More active monitoring of student achievement by senior leaders and staff helped most students to achieve numeracy and literacy requirements for NCEA Level 1 in 2012." | Medium secondary: "A continued focus on teachers using evidence to inquire into the effectiveness of their practice will further enhance outcomes for students." |
| Large primary: "… a clear emphasis on collecting and analysing student achievement data and using it effectively to make positive changes." | Large intermediate: "Data is being used increasingly, and effectively, to make significant improvements to the levels of student achievement over their two+ years at school … There is a deliberate approach by school leaders and teachers to ensure assessment information related to National Standards is valid and accurate." |
| Small secondary: "… uses high quality self-review to shape and reshape strategies that enhance student engagement, progress and achievement. Their results exceed and exemplify their high expectations and commitment to student's achievement." | Small secondary: "Senior leaders and middle managers have received considerable Ministry professional development to help them manage and use achievement information. Work with Ministry personnel did help the school improve the collation and tracking of student achievement. However, it has not been sustained." |
| Large primary: "… leaders and teachers are increasingly using student achievement information to strengthen teacher practice and monitor student progress." | Large intermediate: "As some teachers rely on data from standardised testing at set intervals, they have insufficient evidence to evaluate the effectiveness of strategies they use. With more detailed analysis of data, and closer tracking of priority students, more positive changes could be made." |
| Small primary: "These teachers are improving how they use student achievement information to inform teaching and learning programmes, and are improving their focus on target learners." | Small primary: "Staff and trustees are focused on improving Māori students' success in the Māori world and academically, especially in National Standards. School improvement teams have been established to implement this focus and are building a strong bicultural foundation for learning." |
Source: Latest Education Review Office reports for each school.
Note: The two columns represent the way we sampled schools. The schools in the left-hand column had a large percentage of Māori students at or above National Standards or NCEA Level 2. The schools in the right-hand column had a small percentage of Māori students at or above National Standards or NCEA Level 2. We measured this performance using 2014 data.
2.54
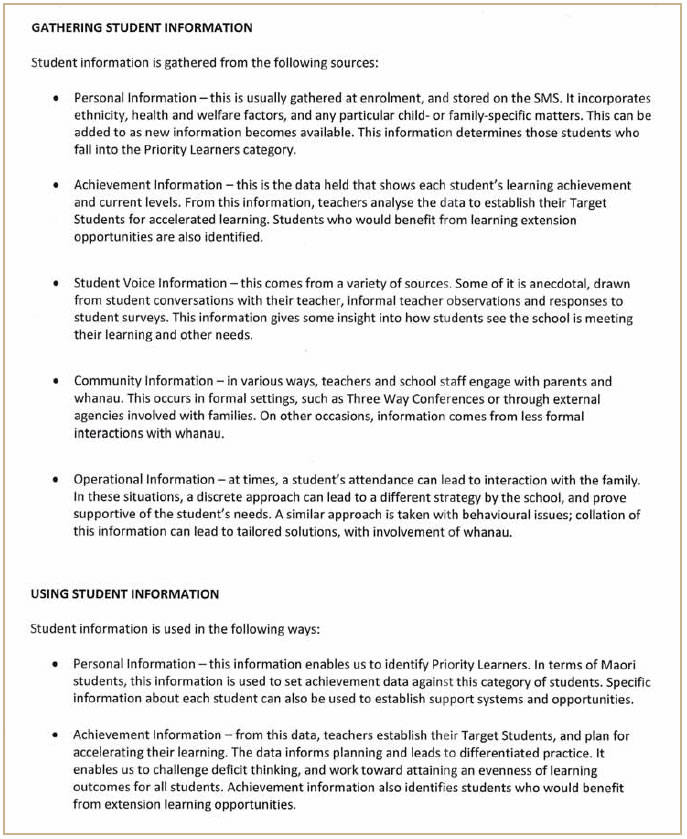
One of the better-performing schools we visited produced a two-page summary about what information meant to the school and how it was used. The principal composed this summary and consulted with staff about its contents. Figure 15 is the first page of that summary. It shows the school's positive approach to using information. In our view, this is an approach that other schools could learn from.
Figure 15
How one school told us it used and valued information
Source: Our school visits.
2.55
This summary highlights how the school demonstrates effective leadership and integrates a wide range of "hard" and "soft" information. The school was also switching to a new student management system that it considered would provide it with a greater capability to collect and use a wider range of student information. ERO also supported the school's approach to using information. ERO commented in its 2013 review report that:
The school is well placed to sustain and improve its performance. Strong foundations have been established … The school is well led by the principal, whose strategic approach to leadership guides ongoing school improvement …Performance management systems have been refined to promote improvements to teaching practice … Teachers are given opportunities for leadership … ERO, trustees and school leaders agree that evaluating progress against strategic goals and more evaluative reporting would better assist the school's self-review processes.
2.56
Another school we visited had participated in a specific university programme aimed at improving Māori and Pasifika student outcomes. As a result, the school improved its use of information to change teaching practices to produce better results. When we visited, this school was considering information about the effect of class streaming.
2.57
Several schools highlighted how they use information to focus resources on students who need more support. These practices included:
- using tracking forms for specific students who need help in making better progress;
- involving students in tracking their own progress;
- using National Standards data to identify students who need help; and
- the principal using assessment information to question teaching practice and working with teachers to see what can be improved.
2.58
The better-performing schools we visited showed a stronger relationship between the school, students, and community. Some schools used student and whānau surveys to evaluate their teaching practice.
2.59
Schools that did not use information quite as well appeared less methodical or less willing to use and analyse information actively to make decisions.
2.60
Our findings are consistent with ERO's findings. It is clear that there is a wide variation in practices between schools. In our view, this relates to variability in leadership, purpose, and the quality of practices for measuring performance and improving processes. There is significant potential for improvement through more consistent practices.
9: See www.educationcounts.govt.nz/topics/national-education.
10: The two other goals are:
- In 2018, 60% of 25-34 year olds will have a qualification at level 4 or above.
- In 2016, 98% of children starting school will have participated in early childhood education.

