Appendix 3: Range in Māori educational success within similar schools and communities
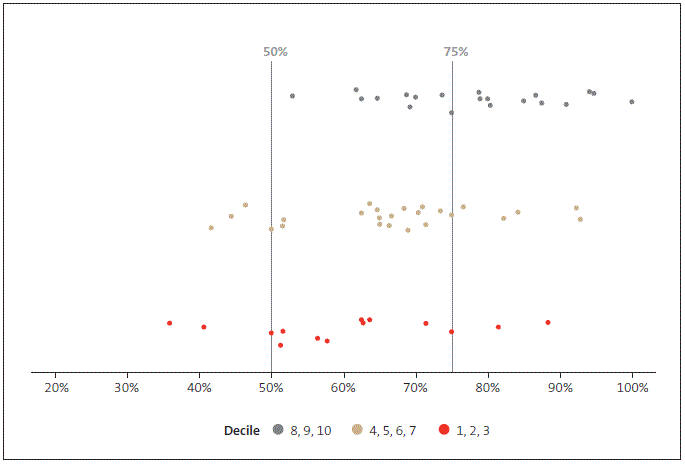
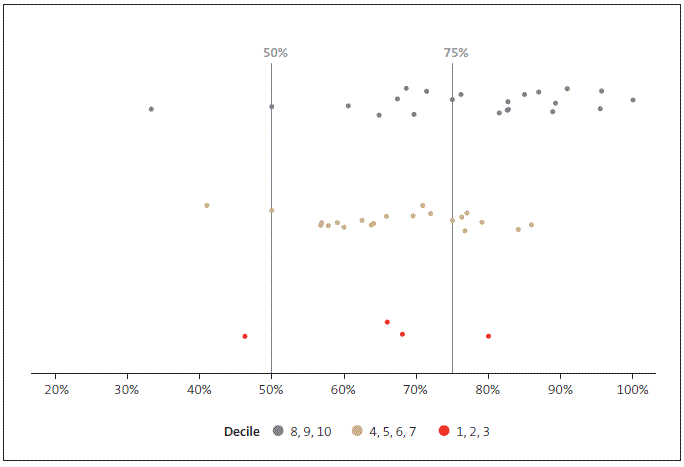
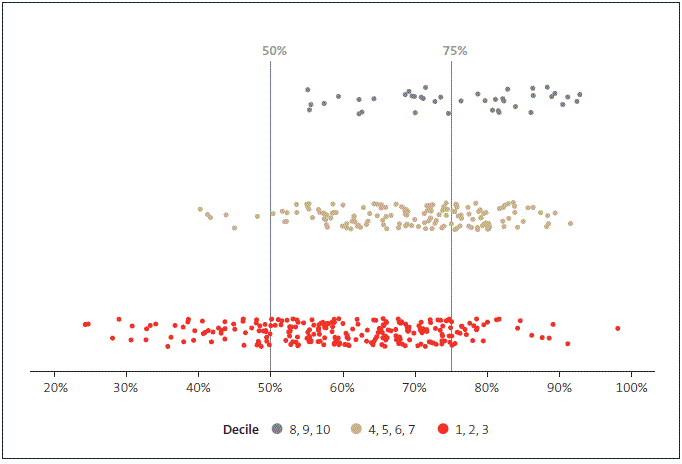
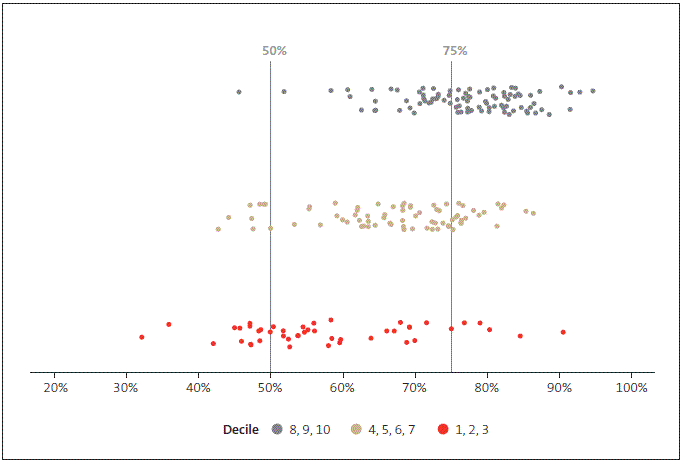
Figures 25-28 show the variability in Māori students' achievement in National Standards and NCEA Level 2 for four selected school categories. A common pattern is that, on the whole, higher decile schools achieve better results. However, there is a large overlap in performance between the groups. Results for Māori students attending schools in similar circumstances vary markedly.
Figure 25
Variability in NCEA Level 2 results, medium secondary schools, 2014

Source: Our analysis of the Ministry of Education's NCEA data. We have excluded schools with fewer than 30 Māori students.
Figure 26
Variability in NCEA Level 2 results, large secondary schools, 2014

Source: Our analysis of the Ministry of Education's NCEA data. We have excluded schools with fewer than 30 Māori students.
Figure 27
Variability in National Standards results, small primary schools, 2014

Source: Our analysis of the Ministry of Education's National Standards data. We have excluded schools with fewer than 30 Māori students.
Figure 28
Variability in National Standards results, large primary schools, 2014

Source: Our analysis of the Ministry of Education's National Standards data. We have excluded schools with fewer than 30 Māori students.

