Part 6 : Some demographics
Geoff Bascand
6.1
In this Part, we report on the Madrid Plan's demographic indicators. Our detailed findings are available at www.oag.govt.nz/2013/ageing.
Older people make up an increasing proportion of the population in all regions except Auckland, and the pace of change has increased. Three women for every two men reach age 80. The older population is projected to continue to be dominated by people identifying as "European" or "New Zealander", although their share will decrease. After reaching pensionable age, about one-third of older people changed their home address but most stayed with the same regional council area.
6.2
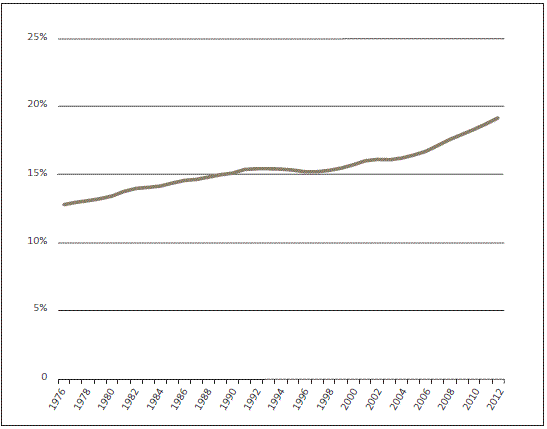
When a population is ageing, older people make up an increasing proportion of the total population. Figure 5 shows that the proportion of people aged 60-plus in the population increased from 13% in 1976 to an estimated 19% in 2012.
Figure 5
Proportion of New Zealand's population aged at least 60, 1976-2012

Source: Statistics New Zealand. See also Indicator 1: Number and proportion of older persons on our website.
6.3
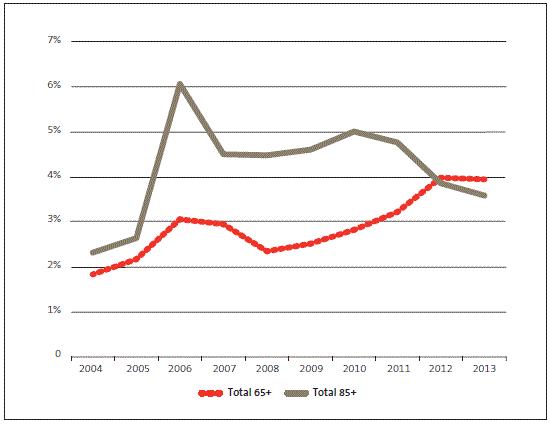
Within the older population, the number in the 65-plus age group grew more slowly than the 85-plus age group. Figure 6 shows that from 2006, the annual rate of population growth for people aged 65-plus was between 2% and 4%. From 2006, it was between 4% and 6% for people aged 85-plus.
Figure 6
Annual population growth rate for people aged at least 65 and people aged at least 85, 2004-13

Source: Statistics New Zealand. See also Indicator 3: Population growth on our website.
6.4
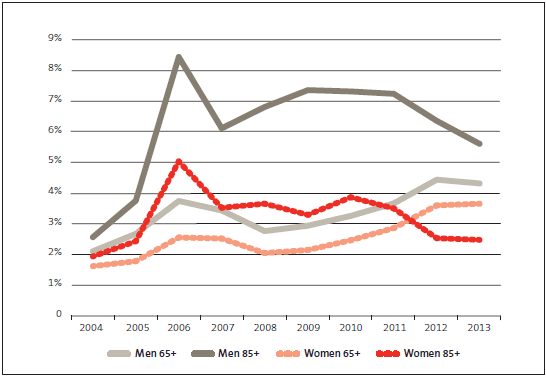
Figure 7 shows that the annual rate of population growth was higher for men aged at least 85 than it was for men aged at least 65 and for women in both age groups. The higher growth rate for men aged 85-plus partly reflects the smaller older male population and more rapid gains in male life expectancy in recent decades. In contrast, the growth rate of older women in the same age groups is lower because their population numbers were higher to begin with.
Figure 7
Annual population growth rate for men and women aged at least 65 and at least 85, 2004-13

Source: Statistics New Zealand. See also Indicator 3: Population growth on our website.
6.5
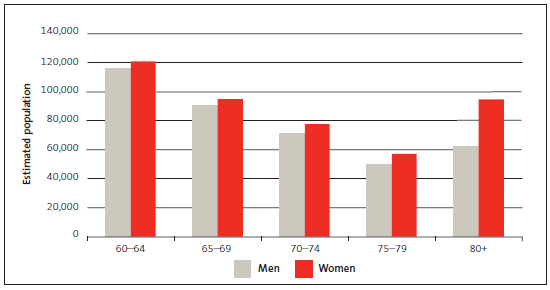
Figure 8 gives a snapshot of the estimated number of men and women aged at least 60 by age group at the end of 2011. There were more women than men in each age group. For the 80-plus age group, there were three women for every two men. The estimated total population aged at least 60 was 837,000.
Figure 8
Estimated population aged at least 60, by sex and five-year age group, at 31 December 2011

Source: Statistics New Zealand.
6.6
The 2013 census will confirm the ethnic make-up of the older population. However, projections for 2012 were that 87% of people aged at least 60 would identify with "European" or "New Zealand" ethnicity, 6% with Māori ethnicity, 6% with an Asian ethnicity, and 3% with a Pacific ethnicity.12 Broadly speaking, most older people will continue to identify as "European" or "New Zealander", although their proportion is decreasing.
6.7
Census data is the best source of data about where older people live. Between the 1996 and 2006 censuses, every region except Auckland experienced an increase in the proportion of older people in its population. Figure 9 lists some relevant findings from the 2001 and 2006 censuses.
Figure 9
Some findings about ageing population from the 2001 and 2006 censuses
| Between the 2001 and 2006 censuses: |
|
| The 2006 census found that: |
|
Source: Statistics New Zealand. See also Indicator 2: Older persons living in urban areas on our website.
6.8
In 2008/09, an estimated 5% of older people lived in residential care. At least 9% of older people were said to be receiving home-based support services in the community. However, this latter figure was underestimated because it was calculated using Ministry of Health data and did not include data on similar services funded by the Accident Compensation Corporation and the Ministry of Social Development.
6.9
Compared to other age groups, few older people were international migrants. In the year to 30 June 2012, 2269 older people moved to New Zealand and 1543 older people left the country. This was about 2% of all permanent and long-term arrivals and 2% of all permanent and long-term departures.
12: These numbers add up to more than 100% because some people identify with more than one ethnicity and all responses are included.

