Part 2 : Defining an ageing population
Simon Upton
2.1
In this Part, we explain what an ageing population is and compare New Zealand's median age with that of some other countries.
2.2
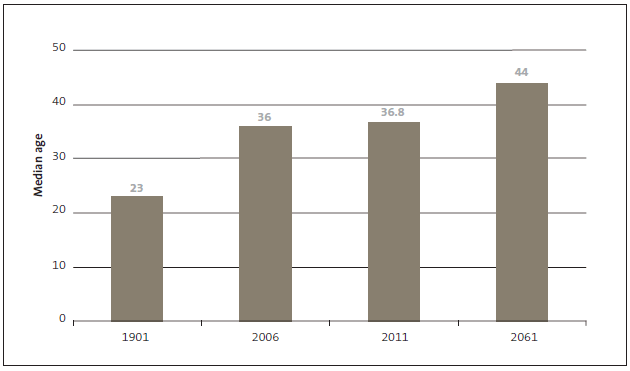
Looking at changes in the median age is an easy way of understanding how a population ages. Half the population is older and half the population is younger than the median age. A population is ageing when the median age is increasing. Figure 1 shows how the population has aged since 1901 and is projected to change by 2061.3
Figure 1
Median ages in New Zealand, selected years from 1901 to 2061

Source: Statistics New Zealand.
2.3
Low death rates (or increased life expectancy) and low birth rates are mainly responsible for ageing populations. Although life expectancy has increased in New Zealand, low birth rates have made a greater contribution to our ageing population.
2.4
Baby booms – large and small – affect the annual growth rates for different parts of the population. The rates differ from year to year but the general trend is the same – the proportion of people aged 0-39 years is decreasing and the proportion of people aged at least 40 is increasing.
2.5
In 2006, children aged 0-14 years outnumbered people aged at least 65 by two to one. In 2011, the first of the post-World War II baby boomers reached age 65. By 2023, there are likely to be more older people than children.
2.6
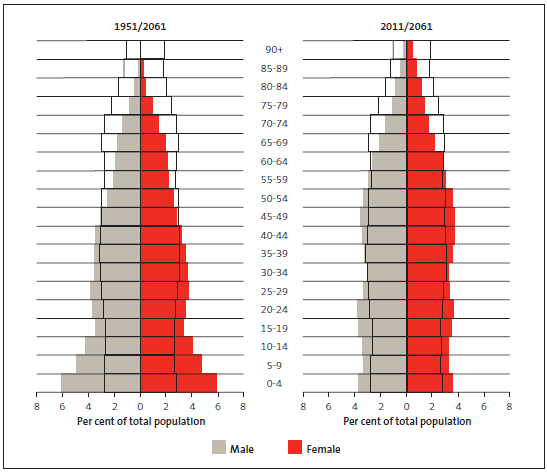
Figure 2 shows how the spire shape of our population in 1951 is projected to change to a more rectangular or chimney shape by 2061. It shows that the proportion of the population in each five-year age group is becoming more alike. In 2013, we are two-thirds of the way through this change.
Figure 2
Projected change in the population profile by five-year age group, 1951, 2011, and 2061

Note: In both graphs, the black outline is the population profile in 2061. In the left-hand graph, the shaded area is the population profile in 1951. In the right-hand graph, the shaded area is the population profile in 2011. Source: Statistics New Zealand.
2.7
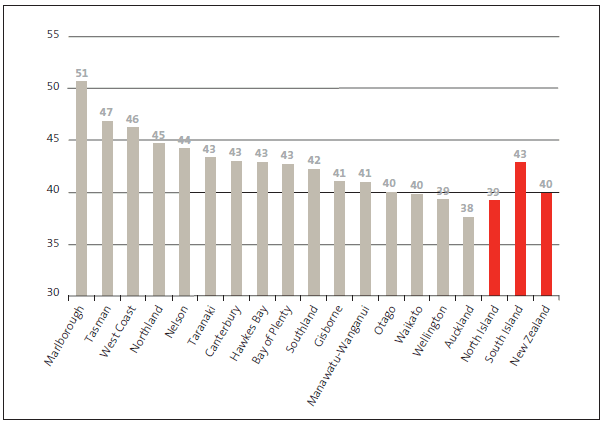
The projected median age differs considerably throughout the country. Figure 3 shows that all regions except Otago, Waikato, Wellington, and Auckland are projected to have median ages higher than the national median age in 2031.
Figure 3
Projected median age by region, 2031

Source: Statistics New Zealand, 1996-2031 (2006-base, October 2012 update), medium projection.
2.8
The pace of ageing differs by region. Between 2011 and 2031, Marlborough's median age is projected to increase by seven years (from 44 years to 51 years) and Auckland's median age will increase by four years (from 34 years to 38 years).
2.9
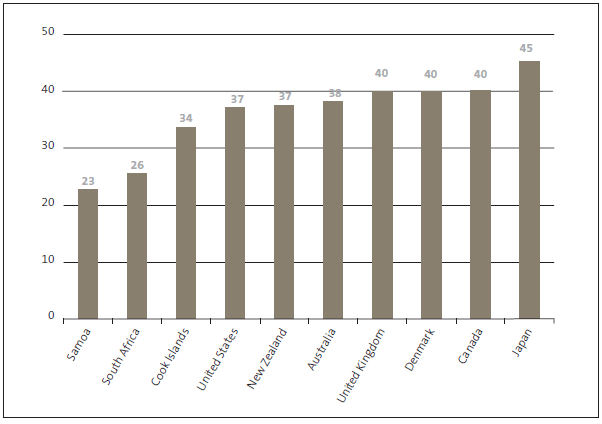
New Zealand is not alone in experiencing an ageing population. The populations of many developed and developing countries are ageing. Figure 4 compares New Zealand's median age with the estimated median ages of a few other countries. It shows that Japan's population is older than ours and our population is older than the populations of South Africa and Samoa. Japan's population is declining, unlike New Zealand's.
Figure 4
Estimated median ages for selected countries, 2010

Source: United Nations (2013), World Population Prospects: The 2012 Revision, esa.un.org.
3: Different projection scenarios will produce different median ages. We used the information that Statistics New Zealand has published for schools at www.stats.govt.nz.

