Part 8 : A statement on older people's circumstances
United Nations Population Fund
8.1
In this Part, we make a general statement about older people's circumstances based on the data we reported for the Madrid outcome indicators.
We found that data was available for most of the Madrid outcome indicators. This enabled us to make an overall statement on older people's circumstances. Although there have been many improvements over time, older people did not experience these improvements evenly. Women, Pākehā, and people on higher incomes often (but not always) benefited more than men, non-Pākehā, and people on lower incomes.
8.2
Human ageing is one of the big challenges facing the developed world and there is much that is uncertain about its effects on older people and the rest of the population. Access to good quality and timely data might help us to better assess and prepare for the effects of ageing.
8.3
We were able to find much of the data needed to report against the Madrid indicators. Our online findings reports give more detail for each indicator than is practical to reproduce in our report. However, we are able to make an overall statement that summarises what the indicators showed.
8.4
For each of the Madrid outcome indicators and its relevant reporting period, we found that:
- Results were often better for older people than for younger people. For example, older people reported higher rates of life satisfaction and health status and lower rates of loneliness than younger adults. However, some indicators were affected by historical practices for example, older people were less highly qualified than younger people.
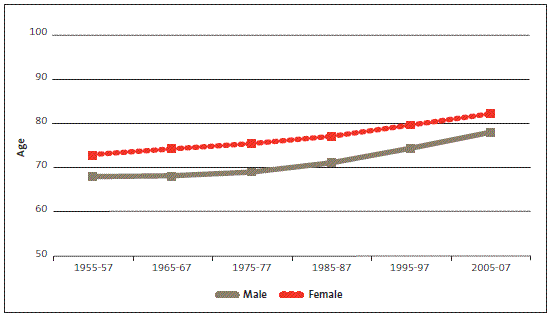
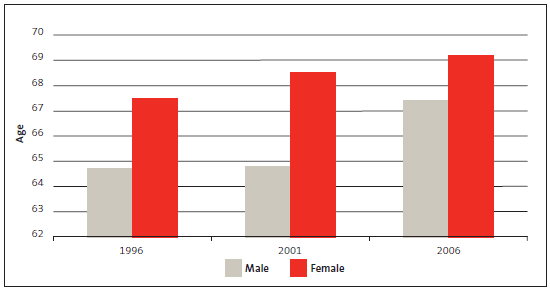
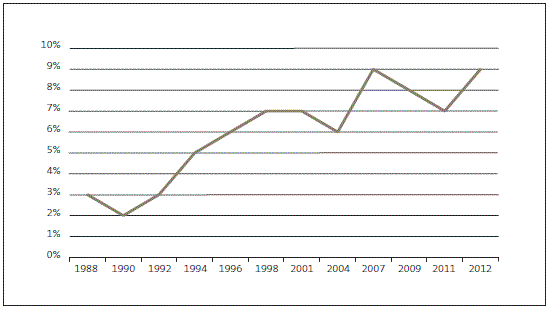
- Over time, results were often improving, such as in disability rates, life expectancy (see Figure 10), independent life expectancy (see Figure 11), and the mortality rate from non-communicable diseases (see Figure 12). However, results were worse for some indicators, such as the housing affordability rate (Figure 13) and the mortality rate from accidents and injuries (see Figure 12).
- Older men and women and ethnic groups did not show uniform improvements. For example, life expectancy is longer for women than men (see Figure 10), and longer for non-Māori than Māori (see Figure 14) where the gap in life expectancy has been affected by changes in data collection practices on ethnicity.
- Older people with higher income levels had better results than older people on lower incomes. For example, older people living in economic hardship were more likely to feel lonely and report lower health status, and an increase in older people's economic standard of living resulted in a larger decrease in loneliness than for younger people.
Figure 10
Total population life expectancy at birth, 1955-57 to 2005-07
Source: Statistics New Zealand. See also Indicator 23: Life expectancy on our website.
Figure 11
Independent life expectancy for men and women at birth, 1996, 2001, and 2006
Source: Statistics New Zealand. See also Indicator 24: Disability-free life expectancy on our website.
Figure 12
Mortality rates per 100,000 population for people aged 60-plus for selected non-communicable diseases and accidents and injuries
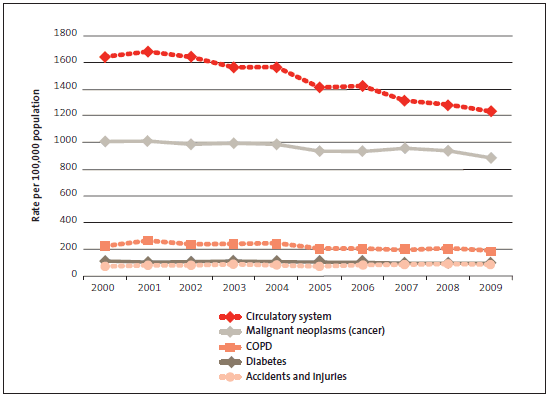
Source: Ministry of Health. See also Indicator 25: Non-communicable diseases and Indicator 26: Mortality rates on our website. "COPD" means chronic obstructive pulmonary disease. "Accidents and injuries" includes deaths from poisoning, falls, motor vehicle crashes, suicide, and drowning.
Figure 13
Proportion of older people in households with housing cost outgoings-to-income ratio greater than 30%, for selected years from 1988 to 2012
Source: Ministry of Social Development (2013), Household incomes in New Zealand: Trends in indicators of inequality and hardship 1982 to 2012. See also Indicator 7: Official poverty line on our website.
Figure 14
Difference in life expectancy at birth between Māori and non-Māori, 1950-52 to 2005-07
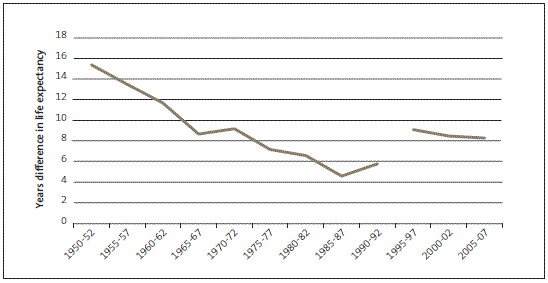
Note: New death registration forms were introduced in 1995, which is why there is a break in the data between 1990-92 and 1995-97. The two sets of data are not directly comparable. Source: Statistics New Zealand. See also Indicator 23: Life expectancy on our website.

