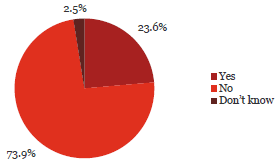
13. I have had fraud awareness training at my current organisation.
Observation:

73.9% of respondents said that they had not received fraud awareness training at their current organisation.
This lack of training was reflected across all roles and levels of organisations.
Of those who had received training, 16.5% had received training in the previous six months and 33.2% in the previous 12 months. A quarter of respondents indicated that they last received training over two years ago.
What some respondents have said:
“We have a very small and senior staff with an extremely low turnover record - hence the limited training needed. Although we do not have a formal Staff Code of Conduct we do have a disciplinary policy and there is reference in our fraud policy which has relevance.”
“We are a bit "hit and miss" - sometimes we provide fraud awareness training, but it isn't consistent.”
“It would appear from these questions that communication of fraud policy is lacking and training is required in respect of what it covers and how to apply and overcome fraud.”
“Where does a Principal get training to identify fraud?”
“I don't think fraud is a significant issue, but more focused training on probity and conflict-of-interest management is required to avoid probity issues caused by naivety.”
Would benefit from stronger leadership expectation setting that it is unacceptable and regular communication about that.”
| Yes | No | Don’t know | Total Count | ||||
|---|---|---|---|---|---|---|---|
| Chief Executive Officer/Managing Director/Principal | 87 | 23% | 291 | 76% | 5 | 1% | 383 |
| Member of the senior executive/leadership team or equivalent | 132 | 27% | 350 | 71% | 9 | 2% | 491 |
| Line manager (if not one of the above) | 53 | 24% | 164 | 75% | 3 | 1% | 220 |
| Administration/Support Services | 48 | 24% | 141 | 71% | 11 | 6% | 200 |
| Operational staff (e.g. Teacher, Analyst, Advisor, Technician, Officer, Engineer, Accountant) | 18 | 13% | 111 | 81% | 8 | 6% | 137 |
| Total | 338 | 24% | 1,057 | 74% | 36 | 3% | 1,431 |
| Yes | No | Don’t know | Total | ||||
|---|---|---|---|---|---|---|---|
| Central Government | |||||||
| Autonomous Crown Entities | 16 | 30% | 38 | 70% | 0 | 0% | 54 |
| Central Government - Other | 10 | 22% | 33 | 73% | 2 | 4% | 45 |
| Crown Agents or Companies | 26 | 30% | 55 | 63% | 6 | 7% | 87 |
| Crown Research Institutes | 7 | 18% | 30 | 79% | 1 | 3% | 38 |
| District Health Boards | 20 | 29% | 50 | 71% | 0 | 0% | 70 |
| Government Departments | 34 | 23% | 108 | 73% | 5 | 3% | 147 |
| Independent Crown Entities | 4 | 11% | 31 | 84% | 2 | 5% | 37 |
| Māori Trust Boards | 2 | 18% | 9 | 82% | 0 | 0% | 11 |
| Rural Education Activities Programmes | 1 | 9% | 10 | 91% | 0 | 0% | 11 |
| State-Owned Enterprises | 14 | 30% | 33 | 70% | 0 | 0% | 47 |
| Tertiary Education Institutions | 35 | 38% | 55 | 60% | 1 | 1% | 91 |
| Sub-Total | 169 | 26% | 452 | 71% | 17 | 3% | 638 |
| Yes | No | Don’t know | Total | ||||
|---|---|---|---|---|---|---|---|
| Local Government | |||||||
| Airports | 7 | 37% | 11 | 58% | 1 | 5% | 19 |
| Council Controlled Organisations or Council Controlled Trading Organisations | 17 | 23% | 56 | 75% | 2 | 3% | 75 |
| Energy Companies | 12 | 43% | 15 | 54% | 1 | 4% | 28 |
| Fish and Game Councils | 3 | 38% | 5 | 63% | 0 | 0% | 8 |
| Licensing and Community Trusts | 1 | 11% | 8 | 89% | 0 | 0% | 9 |
| Local Authorities | 38 | 22% | 129 | 76% | 2 | 1% | 169 |
| Local Government - Other | 1 | 9% | 10 | 91% | 0 | 0% | 11 |
| Port Companies | 1 | 33% | 2 | 67% | 0 | 0% | 3 |
| Sub-Total | 80 | 25% | 236 | 73% | 6 | 2% | 322 |
| Schools | 89 | 19% | 369 | 78% | 13 | 3% | 471 |
| Total | 338 | 24% | 1,057 | 74% | 36 | 3% | 1,431 |

