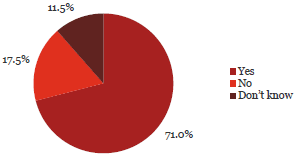
12. New employees at my organisation undergo pre-employment screening that includes criminal history checks.

Observation:
71% of respondents said that their organisation has pre-employment screening.
78% of Chief Executives said that their organisations had pre-employment screening processes that included criminal history checks.
What some respondents have said:
“While we do not undertake formal criminal record checks for every prospective employee we do make provision for doing this if deemed necessary.”
“My answer was yes but only some new employees have their criminal history checked.”
“Fraud awareness training is underway with key managers, and a rationalisation of suppliers is underway which will assist any the reduction in opportunities to defraud or collude with suppliers and specific probity checks are carried on a regular cycle and on key executives or people in certain positions if any resignations of such positions.”
“Depends on the position.”
| Yes | No | Don’t know | Total Count | ||||
|---|---|---|---|---|---|---|---|
| Chief Executive Officer/Managing Director/Principal | 297 | 78% | 70 | 18% | 16 | 4% | 383 |
| Member of the senior executive/leadership team or equivalent | 341 | 69% | 104 | 21% | 46 | 9% | 491 |
| Line manager (if not one of the above) | 138 | 63% | 41 | 19% | 41 | 19% | 220 |
| Administration/Support Services | 160 | 80% | 17 | 9% | 23 | 12% | 200 |
| Operational staff (e.g. Teacher, Analyst, Advisor, Technician, Officer, Engineer, Accountant) | 80 | 58% | 19 | 14% | 38 | 28% | 137 |
| Total | 1,016 | 71% | 251 | 18% | 164 | 11% | 1,431 |
| Yes | No | Don’t know | Total | ||||
|---|---|---|---|---|---|---|---|
| Central Government | |||||||
| Autonomous Crown Entities | 29 | 54% | 18 | 33% | 7 | 13% | 54 |
| Central Government - Other | 19 | 42% | 19 | 42% | 7 | 16% | 45 |
| Crown Agents or Companies | 51 | 59% | 24 | 28% | 12 | 14% | 87 |
| Crown Research Institutes | 20 | 53% | 11 | 29% | 7 | 18% | 38 |
| District Health Boards | 53 | 76% | 10 | 14% | 7 | 10% | 70 |
| Government Departments | 109 | 74% | 21 | 14% | 17 | 12% | 147 |
| Independent Crown Entities | 17 | 46% | 12 | 32% | 8 | 22% | 37 |
| Māori Trust Boards | 9 | 82% | 2 | 18% | 0 | 0% | 11 |
| Rural Education Activities Programmes | 11 | 100% | 0 | 0% | 0 | 0% | 11 |
| State-Owned Enterprises | 31 | 66% | 9 | 19% | 7 | 15% | 47 |
| Tertiary Education Institutions | 45 | 49% | 22 | 24% | 24 | 26% | 91 |
| Sub-Total | 394 | 62% | 148 | 23% | 96 | 15% | 638 |
| Yes | No | Don’t know | Total | ||||
|---|---|---|---|---|---|---|---|
| Local Government | |||||||
| Airports | 12 | 63% | 1 | 5% | 6 | 32% | 19 |
| Council Controlled Organisations or Council Controlled Trading Organisations | 33 | 44% | 27 | 36% | 15 | 20% | 75 |
| Energy Companies | 14 | 50% | 9 | 32% | 5 | 18% | 28 |
| Fish and Game Councils | 7 | 88% | 1 | 13% | 0 | 0% | 8 |
| Licensing and Community Trusts | 4 | 44% | 3 | 33% | 2 | 22% | 9 |
| Local Authorities | 83 | 49% | 51 | 30% | 35 | 21% | 169 |
| Local Government - Other | 5 | 45% | 5 | 45% | 1 | 9% | 11 |
| Port Companies | 2 | 67% | 1 | 33% | 0 | 0% | 3 |
| Sub-Total | 160 | 50% | 98 | 30% | 64 | 20% | 322 |
| Schools | 462 | 98% | 5 | 1% | 4 | 1% | 471 |
| Total | 1,016 | 71% | 251 | 18% | 164 | 11% | 1,431 |

