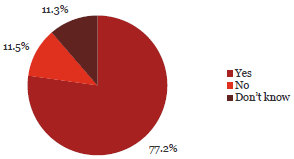
11. My organisation takes a proactive approach to preventing fraud and corruption.
Observation:

77.2% say their organisation takes a proactive approach to prevention.
Management responded more favourably to their organisation having a proactive approach to preventing fraud, while only 66% of operational staff shared the same view.
What some respondents have said:
“We are a very small team of three full time and one part time employees. We work closely together and support each other and are aware of each others work. We have a policy on Discipline and on Fraud. We have an Audit and Risk Board Committee and a schedule of checks and balances. I consider we manage our risk very well.”
“Over 2 years ago we dealt with a most unfortunate case within the staff and as a result of our swift and transparent resolution of the matter, and a public prosecution and conviction, there continues a very high level of vigilance and awareness of the Council's clear resolve to deal firmly with any transgressions. Also we have reviewed our systems and procedures to ensure we have a reduced risk profile. I would offer a view that notwithstanding our efforts to maintain a culture of trust and integrity into our operation, and despite our best endeavours to have failsafe systems, we will always be vulnerable to the predations of those who deliberately set out to offend.”
| Yes | No | Don’t know | Total Count | ||||
|---|---|---|---|---|---|---|---|
| Chief Executive Officer/Managing Director/Principal | 323 | 84% | 47 | 12% | 13 | 3% | 383 |
| Member of the senior executive/leadership team or equivalent | 386 | 79% | 64 | 13% | 41 | 8% | 491 |
| Line manager (if not one of the above) | 147 | 67% | 27 | 12% | 46 | 21% | 220 |
| Administration/Support Services | 158 | 79% | 12 | 6% | 30 | 15% | 200 |
| Operational staff (e.g. Teacher, Analyst, Advisor, Technician, Officer, Engineer, Accountant) | 91 | 66% | 14 | 10% | 32 | 23% | 137 |
| Total | 1,105 | 77% | 164 | 11% | 162 | 11% | 1,431 |
| Yes | No | Don’t know | Total | ||||
|---|---|---|---|---|---|---|---|
| Central Government | |||||||
| Autonomous Crown Entities | 50 | 93% | 2 | 4% | 2 | 4% | 54 |
| Central Government - Other | 38 | 84% | 2 | 4% | 5 | 11% | 45 |
| Crown Agents or Companies | 71 | 82% | 8 | 9% | 8 | 9% | 87 |
| Crown Research Institutes | 30 | 79% | 3 | 8% | 5 | 13% | 38 |
| District Health Boards | 53 | 76% | 7 | 10% | 10 | 14% | 70 |
| Government Departments | 104 | 71% | 18 | 12% | 25 | 17% | 147 |
| Independent Crown Entities | 30 | 81% | 4 | 11% | 3 | 8% | 37 |
| Māori Trust Boards | 9 | 82% | 2 | 18% | 0 | 0% | 11 |
| Rural Education Activities Programmes | 8 | 73% | 2 | 18% | 1 | 9% | 11 |
| State-Owned Enterprises | 33 | 70% | 3 | 6% | 11 | 23% | 47 |
| Tertiary Education Institutions | 68 | 75% | 10 | 11% | 13 | 14% | 91 |
| Sub-Total | 494 | 77% | 61 | 10% | 83 | 13% | 638 |
| Yes | No | Don’t know | Total | ||||
|---|---|---|---|---|---|---|---|
| Local Government | |||||||
| Airports | 14 | 74% | 1 | 5% | 4 | 21% | 19 |
| Council Controlled Organisations or Council Controlled Trading Organisations | 60 | 80% | 7 | 9% | 8 | 11% | 75 |
| Energy Companies | 22 | 79% | 5 | 18% | 1 | 4% | 28 |
| Fish and Game Councils | 7 | 88% | 1 | 13% | 0 | 0% | 8 |
| Licensing and Community Trusts | 6 | 67% | 2 | 22% | 1 | 11% | 9 |
| Local Authorities | 104 | 62% | 38 | 22% | 27 | 16% | 169 |
| Local Government - Other | 8 | 73% | 2 | 18% | 1 | 9% | 11 |
| Port Companies | 1 | 33% | 0 | 0% | 2 | 67% | 3 |
| Sub-Total | 222 | 69% | 56 | 17% | 44 | 14% | 322 |
| Schools | 389 | 83% | 47 | 10% | 35 | 7% | 471 |
| Total | 1,105 | 77% | 164 | 11% | 162 | 11% | 1,431 |

