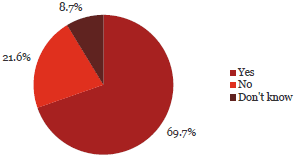
4. The staff Code of Conduct is communicated regularly (annually or biannually).
Observation:

69.7% of respondents said their Code of Conduct is communicated regularly.
79% of Chief Executives indicated that their Code of Conduct was communicated regularly, however 62% of line managers and 54% of operational staff indicated similarly. This may indicate that communication of the Code of Conduct has been ineffective.
What some respondents have said:
“Procurement run regular training sessions on being open and transparent and HR run courses on code of conduct.”
“All employees are regularly reminded about the organisation's Code of Ethical Conduct and the Protected Disclosures Policy. “
“Awareness of fraud and expected Code of Conduct is articulated, however there are improvements that could be made but it is a principle of diminishing returns for the extra effort.”
“It would be useful for our organisation to refresh us on our code of conduct every year and publish our fraud policy and who and what gets done... this may act as a deterrent to those considering the risks v the gains of committing fraud. Thanks for the opportunity to participate.”
| Yes | No | Don’t know | Total Count | ||||
|---|---|---|---|---|---|---|---|
| Chief Executive Officer/Managing Director/Principal | 273 | 79% | 60 | 17% | 13 | 4% | 346 |
| Member of the senior executive/leadership team or equivalent | 325 | 71% | 97 | 21% | 38 | 8% | 460 |
| Line manager (if not one of the above) | 127 | 62% | 60 | 29% | 19 | 9% | 206 |
| Administration/Support Services | 124 | 70% | 30 | 17% | 22 | 13% | 176 |
| Operational staff (e.g. Teacher, Analyst, Advisor, Technician, Officer, Engineer, Accountant) | 72 | 54% | 39 | 29% | 23 | 17% | 134 |
| Total | 921 | 70% | 286 | 22% | 115 | 9% | 1,322 |
| Yes | No | Don’t know | Total | ||||
|---|---|---|---|---|---|---|---|
| Central Government | |||||||
| Autonomous Crown Entities | 43 | 80% | 7 | 13% | 4 | 7% | 54 |
| Central Government - Other | 23 | 53% | 15 | 35% | 5 | 12% | 43 |
| Crown Agents or Companies | 61 | 73% | 15 | 18% | 8 | 10% | 84 |
| Crown Research Institutes | 25 | 71% | 8 | 23% | 2 | 6% | 35 |
| District Health Boards | 41 | 60% | 21 | 31% | 6 | 9% | 68 |
| Government Departments | 103 | 71% | 35 | 24% | 8 | 5% | 146 |
| Independent Crown Entities | 18 | 56% | 8 | 25% | 6 | 19% | 32 |
| Māori Trust Boards | 6 | 60% | 3 | 30% | 1 | 10% | 10 |
| Rural Education Activities Programmes | 7 | 64% | 3 | 27% | 1 | 9% | 11 |
| State-Owned Enterprises | 30 | 68% | 9 | 20% | 5 | 11% | 44 |
| Tertiary Education Institutions | 56 | 67% | 19 | 23% | 8 | 10% | 83 |
| Sub-Total | 413 | 68% | 143 | 23% | 54 | 9% | 610 |
| Yes | No | Don’t know | Total | ||||
|---|---|---|---|---|---|---|---|
| Local Government | |||||||
| Airports | 7 | 47% | 3 | 20% | 5 | 33% | 15 |
| Council Controlled Organisations or Council Controlled Trading Organisations | 44 | 70% | 11 | 17% | 8 | 13% | 63 |
| Energy Companies | 11 | 48% | 12 | 52% | 0 | 0% | 23 |
| Fish and Game Councils | 5 | 71% | 2 | 29% | 0 | 0% | 7 |
| Licensing and Community Trusts | 6 | 75% | 2 | 25% | 0 | 0% | 8 |
| Local Authorities | 86 | 54% | 58 | 37% | 14 | 9% | 158 |
| Local Government - Other | 4 | 40% | 5 | 50% | 1 | 10% | 10 |
| Port Companies | 0 | 0% | 2 | 100% | 0 | 0% | 2 |
| Sub-Total | 163 | 57% | 95 | 33% | 28 | 10% | 286 |
| Schools | 345 | 81% | 48 | 11% | 33 | 8% | 426 |
| Total | 921 | 70% | 286 | 22% | 115 | 9% | 1,322 |

