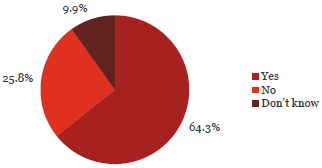
2. The Fraud Policy is communicated regularly (annually or biannually)
Observation:

64.3% of respondents said their fraud policy is communicated regularly.
76% of Chief Executives indicated that their fraud policy was communicated regularly. However, only 51% of line managers and 47% of operational staff indicated similarly.
Organisations with better communication of existing fraud policies had a slightly decreased occurrence of fraud (23% compared with 28%).
Employees who had been at the organisation for a longer period have greater awareness of a fraud policy. Around 80% of employees who had been with the organisation for more than 3 years identified that their organisation had a fraud policy compared with around 60% of employees that have been at the organisation for less than a year.
What some respondents have said:
“We don't do annual communication of fraud policy because it is communicated constantly. Fraud is only a subset of unacceptable behaviours and they are communicated together. We have other controls in place that are not picked up in your survey.”
“We have a detailed policy on sensitive expenditure and gifts. I am unaware as to how well the detail of this is understood at below line manager level, but am certain that all employees are aware of the implicit requirements of the code of conduct.”
“We have recently established a fraud policy and are due to roll out across the department including training for managers and employees. Fraud is also covered as part of the Code of Conduct training.”
“We have policy but whether our efforts to convey that to our employees is effective is not known at this stage.”
| Yes | No | Don’t know | Total Count |
||||
|---|---|---|---|---|---|---|---|
| Chief Executive Officer/Managing Director/Principal | 247 | 76% | 61 | 19% | 17 | 5% | 325 |
| Member of the senior executive/leadership team or equivalent | 244 | 62% | 115 | 29% | 34 | 9% | 393 |
| Line manager (if not one of the above) | 83 | 51% | 57 | 35% | 23 | 14% | 163 |
| Administration/Support Services | 116 | 69% | 30 | 18% | 21 | 13% | 167 |
| Operational staff (e.g. Teacher, Analyst, Advisor, Technician, Officer, Engineer, Accountant) | 45 | 47% | 32 | 34% | 18 | 19% | 95 |
| Total | 735 | 64% | 295 | 26% | 113 | 10% | 1,143 |
| Yes | No | Don’t know | Total | ||||
|---|---|---|---|---|---|---|---|
| Central Government | |||||||
| Autonomous Crown Entities | 37 | 73% | 11 | 22% | 3 | 6% | 51 |
| Central Government - Other | 25 | 68% | 7 | 19% | 5 | 14% | 37 |
| Crown Agents or Companies | 55 | 71% | 18 | 23% | 5 | 6% | 78 |
| Crown Research Institutes | 19 | 59% | 9 | 28% | 4 | 13% | 32 |
| District Health Boards | 32 | 58% | 15 | 27% | 8 | 15% | 55 |
| Government Departments | 60 | 50% | 42 | 35% | 17 | 14% | 119 |
| Independent Crown Entities | 18 | 56% | 8 | 25% | 6 | 19% | 32 |
| Māori Trust Boards | 3 | 50% | 2 | 33% | 1 | 17% | 6 |
| Rural Education Activities Programmes | 3 | 38% | 4 | 50% | 1 | 13% | 8 |
| State-Owned Enterprises | 25 | 64% | 10 | 26% | 4 | 10% | 39 |
| Tertiary Education Institutions | 61 | 76% | 14 | 18% | 5 | 6% | 80 |
| Sub-Total | 338 | 63% | 140 | 26% | 59 | 11% | 537 |
| Yes | No | Don’t know | Total | ||||
|---|---|---|---|---|---|---|---|
| Local Government | |||||||
| Airports | 7 | 50% | 5 | 36% | 2 | 14% | 14 |
| Council Controlled Organisations or Council Controlled Trading Organisations | 44 | 70% | 11 | 17% | 8 | 13% | 63 |
| Energy Companies | 11 | 58% | 7 | 37% | 1 | 5% | 19 |
| Fish and Game Councils | 5 | 71% | 2 | 29% | 0 | 0% | 7 |
| Licensing and Community Trusts | 2 | 40% | 3 | 60% | 0 | 0% | 5 |
| Local Authorities | 66 | 50% | 54 | 41% | 13 | 10% | 133 |
| Local Government - Other | 1 | 25% | 2 | 50% | 1 | 25% | 4 |
| Port Companies | 0 | 0% | 0 | 0% | 0 | 0% | 0 |
| Sub-Total | 136 | 56% | 84 | 34% | 25 | 10% | 245 |
| Schools | 261 | 72% | 71 | 20% | 29 | 8% | 361 |
| Total | 735 | 64% | 295 | 26% | 113 | 10% | 1,143 |

