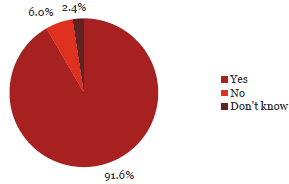
3. My organisation has a staff Code of Conduct.
Observation:

91.6% of participants said their organisation had a Code of Conduct.
Chief executives (90%), senior managers (93%), line managers (93%) and general staff indicated high awareness of a Code of Conduct in their organisation.
What some respondents have said:
“Processes have improved as the result of a fraudulent act in our work place. My workplace has zero tolerance of Fraud and a Code of Conduct.”
“I’m sure that we have some kind of system here but frankly it seems it is passive rather than active. We have our Code of Conduct online but we do not have an annual reminder. I have only seen fraud information as a general reminder to managers to be vigilant in these tough economic times.”
“Code of Conduct has embedded fraud policy requirements in it – seen as more powerful way of cementing good behaviour than separate policy.”
“We are currently reviewing our fraud policy (last reviewed in depth in 2006), to ensure it aligns with our recently updated sensitive expenditure policies and code of conduct.”
| Yes | No | Don’t know | Total Count | ||||
|---|---|---|---|---|---|---|---|
| Chief Executive Officer/Managing Director/Principal | 346 | 90% | 34 | 9% | 4 | 1% | 384 |
| Member of the senior executive/leadership team or equivalent | 460 | 93% | 27 | 5% | 8 | 2% | 495 |
| Line manager (if not one of the above) | 206 | 93% | 8 | 4% | 7 | 3% | 221 |
| Administration/Support Services | 175 | 86% | 14 | 7% | 14 | 7% | 203 |
| Operational staff (e.g. Teacher, Analyst, Advisor, Technician, Officer, Engineer, Accountant) | 134 | 96% | 3 | 2% | 2 | 1% | 139 |
| Total | 1,321 | 92% | 86 | 6% | 35 | 2% | 1,442 |
| Yes | No | Don’t know | Total | ||||
|---|---|---|---|---|---|---|---|
| Central Government | |||||||
| Autonomous Crown Entities | 54 | 100% | 0 | 0% | 0 | 0% | 54 |
| Central Government - Other | 44 | 94% | 1 | 2% | 2 | 4% | 47 |
| Crown Agents or Companies | 84 | 97% | 2 | 2% | 1 | 1% | 87 |
| Crown Research Institutes | 35 | 92% | 3 | 8% | 0 | 0% | 38 |
| District Health Boards | 68 | 97% | 1 | 1% | 1 | 1% | 70 |
| Government Departments | 146 | 98% | 1 | 1% | 2 | 1% | 149 |
| Independent Crown Entities | 32 | 86% | 4 | 11% | 1 | 3% | 37 |
| Māori Trust Boards | 10 | 91% | 1 | 9% | 0 | 0% | 11 |
| Rural Education Activities Programmes | 11 | 100% | 0 | 0% | 0 | 0% | 11 |
| State-Owned Enterprises | 44 | 92% | 3 | 6% | 1 | 2% | 48 |
| Tertiary Education Institutions | 83 | 91% | 6 | 7% | 2 | 2% | 91 |
| Sub-Total | 611 | 95% | 22 | 3% | 10 | 2% | 643 |
| Yes | No | Don’t know | Total | ||||
|---|---|---|---|---|---|---|---|
| Local Government | |||||||
| Airports | 15 | 75% | 4 | 20% | 1 | 5% | 20 |
| Council Controlled Organisations or Council Controlled Trading Organisations | 63 | 83% | 9 | 12% | 4 | 5% | 76 |
| Energy Companies | 23 | 82% | 5 | 18% | 0 | 0% | 28 |
| Fish and Game Councils | 7 | 88% | 1 | 13% | 0 | 0% | 8 |
| Licensing and Community Trusts | 8 | 89% | 1 | 11% | 0 | 0% | 9 |
| Local Authorities | 157 | 93% | 7 | 4% | 5 | 3% | 169 |
| Local Government - Other | 10 | 91% | 1 | 9% | 0 | 0% | 11 |
| Port Companies | 2 | 67% | 1 | 33% | 0 | 0% | 3 |
| Sub-Total | 285 | 88% | 29 | 9% | 10 | 3% | 324 |
| Schools | 425 | 89% | 35 | 7% | 15 | 3% | 475 |
| Total | 1,321 | 92% | 86 | 6% | 35 | 2% | 1,442 |

