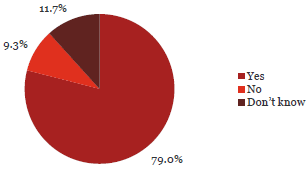
1. My organisation has a Fraud Policy.
Observation:

79% of participants said their organisation had a fraud policy.
Senior staff were more aware of their organisation having a fraud policy. 84% of Chief Executives, 79% of senior managers and 73% of line managers said they had a fraud policy.
82% of administration and support staff and 68% of operational staff said their organisation had a fraud policy.
What some respondents have said:
“Although we do not have a "fraud policy" we cover fraud off in other policies.”
“We have relatively good processes but no specific “Fraud Policy”. To date things seems to work well and an eye is kept on things to avoid risks in this area.”
“We are very aware of the possibility and I have used outsiders to carry out audits in addition to the normal audits. A formal policy seems over the top for an organisation of just 11 people.”
“Fraud is not an issue for our organisation and as such does not require any formal prevention measures other than being part of policy document and induction pack for new staff.”
| Yes | No | Don’t know | Total Count | ||||
|---|---|---|---|---|---|---|---|
| Chief Executive Officer/Managing Director/Principal | 323 | 84% | 51 | 12% | 11 | 3% | 385 |
| Member of the senior executive/leadership team or equivalent | 395 | 79% | 44 | 9% | 58 | 11% | 497 |
| Line manager (if not one of the above) | 162 | 73% | 20 | 9% | 39 | 18% | 221 |
| Administration/Support Services | 169 | 82% | 10 | 5% | 26 | 13% | 205 |
| Operational staff (e.g. Teacher, Analyst, Advisor, Technician, Officer, Engineer, Accountant) | 94 | 68% | 10 | 7% | 35 | 25% | 139 |
| Total | 1,143 | 79% | 135 | 9% | 169 | 12% | 1,447 |
| Yes | No | Don’t know | Total | ||||
|---|---|---|---|---|---|---|---|
| Central Government | |||||||
| Autonomous Crown Entities | 51 | 94% | 1 | 2% | 2 | 4% | 54 |
| Central Government - Other | 37 | 79% | 7 | 15% | 3 | 6% | 47 |
| Crown Agents or Companies | 78 | 90% | 3 | 3% | 6 | 7% | 87 |
| Crown Research Institutes | 32 | 84% | 3 | 8% | 3 | 8% | 38 |
| District Health Boards | 57 | 79% | 2 | 3% | 13 | 18% | 72 |
| Government Departments | 118 | 79% | 9 | 6% | 22 | 15% | 149 |
| Independent Crown Entities | 32 | 86% | 1 | 3% | 4 | 11% | 37 |
| Māori Trust Boards | 6 | 55% | 4 | 36% | 1 | 9% | 11 |
| Rural Education Activities Programmes | 8 | 73% | 2 | 18% | 1 | 9% | 11 |
| State-Owned Enterprises | 40 | 82% | 5 | 10% | 4 | 8% | 49 |
| Tertiary Education Institutions | 80 | 88% | 1 | 1% | 10 | 11% | 91 |
| Sub-Total | 539 | 83% | 38 | 6% | 69 | 11% | 646 |
| Yes | No | Don’t know | Total | ||||
|---|---|---|---|---|---|---|---|
| Local Government | |||||||
| Airports | 14 | 70% | 0 | 0% | 6 | 30% | 20 |
| Council Controlled Organisations or Council Controlled Trading Organisations | 63 | 83% | 9 | 12% | 4 | 5% | 76 |
| Energy Companies | 19 | 68% | 7 | 25% | 2 | 7% | 28 |
| Fish and Game Councils | 7 | 88% | 1 | 13% | 0 | 0% | 8 |
| Licensing and Community Trusts | 5 | 56% | 4 | 44% | 0 | 0% | 9 |
| Local Authorities | 133 | 79% | 19 | 11% | 17 | 10% | 169 |
| Local Government - Other | 4 | 36% | 7 | 64% | 0 | 0% | 11 |
| Port Companies | 0 | 0% | 2 | 67% | 1 | 33% | 3 |
| Sub-Total | 245 | 76% | 49 | 15% | 30 | 9% | 324 |
| Schools | 359 | 75% | 48 | 10% | 70 | 15% | 477 |
| Total | 1,143 | 79% | 135 | 9% | 169 | 12% | 1,447 |

