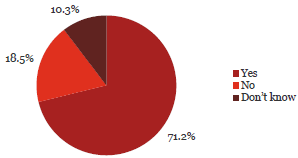
5. My organisation has a clear policy on accepting gifts or services.
Observation:

71.2% of respondents indicated that their organisation has a gifts policy.
29.8% said receiving gifts was never acceptable (see question 6).
63% of Chief Executive said they had a clear gifts policy. More line managers (86%), senior executive (76%) and operational staff (73%) said that their organisation had a clear gifts policy.
What some respondents have said:
“Acceptable provided it is below monetary limits as outlined in gift policy, is declared to manager and/on internal register and does not place you in a position whereby your financial decision making is influenced. For example: not acceptable to accept before or during contract negotiations.”
“Cannot be seen as compromising integrity.”
“Value limits are placed on any gifts in addition to restrictions due to any real or perceived undue influence that might arise as a result of a gift (e.g. gifts received when a contract is in the process of being tendered).”
“Children often thank teachers with small gifts. Parents sometimes give the school small gifts.”
| Yes | No | Don’t know | Total Count | ||||
|---|---|---|---|---|---|---|---|
| Chief Executive Officer/Managing Director/Principal | 243 | 63% | 123 | 32% | 18 | 5% | 384 |
| Member of the senior executive/leadership team or equivalent | 374 | 76% | 68 | 14% | 52 | 11% | 494 |
| Line manager (if not one of the above) | 190 | 86% | 15 | 7% | 16 | 7% | 221 |
| Administration/Support Services | 117 | 58% | 43 | 21% | 42 | 21% | 202 |
| Operational staff (e.g. Teacher, Analyst, Advisor, Technician, Officer, Engineer, Accountant) | 101 | 73% | 17 | 12% | 21 | 15% | 139 |
| Total | 1,025 | 71% | 266 | 18% | 149 | 10% | 1,440 |
| Yes | No | Don’t know | Total | ||||
|---|---|---|---|---|---|---|---|
| Central Government | |||||||
| Autonomous Crown Entities | 53 | 98% | 1 | 2% | 0 | 0% | 54 |
| Central Government - Other | 36 | 78% | 6 | 13% | 4 | 9% | 46 |
| Crown Agents or Companies | 84 | 97% | 1 | 1% | 2 | 2% | 87 |
| Crown Research Institutes | 33 | 87% | 2 | 5% | 3 | 8% | 38 |
| District Health Boards | 63 | 90% | 3 | 4% | 4 | 6% | 70 |
| Government Departments | 144 | 97% | 2 | 1% | 3 | 2% | 149 |
| Independent Crown Entities | 35 | 95% | 2 | 5% | 0 | 0% | 37 |
| Māori Trust Boards | 6 | 55% | 3 | 27% | 2 | 18% | 11 |
| Rural Education Activities Programmes | 4 | 36% | 6 | 55% | 1 | 9% | 11 |
| State-Owned Enterprises | 44 | 92% | 3 | 6% | 1 | 2% | 48 |
| Tertiary Education Institutions | 77 | 85% | 4 | 4% | 10 | 11% | 91 |
| Sub-Total | 579 | 90% | 33 | 5% | 30 | 5% | 642 |
| Yes | No | Don’t know | Total | ||||
|---|---|---|---|---|---|---|---|
| Local Government | |||||||
| Airports | 14 | 70% | 2 | 10% | 4 | 20% | 20 |
| Council Controlled Organisations or Council Controlled Trading Organisations | 64 | 84% | 6 | 8% | 6 | 8% | 76 |
| Energy Companies | 22 | 79% | 6 | 21% | 0 | 0% | 28 |
| Fish and Game Councils | 5 | 63% | 1 | 13% | 2 | 25% | 8 |
| Licensing and Community Trusts | 2 | 22% | 6 | 67% | 1 | 11% | 9 |
| Local Authorities | 137 | 81% | 20 | 12% | 12 | 7% | 169 |
| Local Government - Other | 4 | 36% | 6 | 55% | 1 | 9% | 11 |
| Port Companies | 2 | 67% | 1 | 33% | 0 | 0% | 3 |
| Sub-Total | 250 | 77% | 48 | 15% | 26 | 8% | 324 |
| Schools | 196 | 41% | 185 | 39% | 93 | 20% | 474 |
| Total | 1,025 | 71% | 266 | 18% | 149 | 10% | 1,440 |

