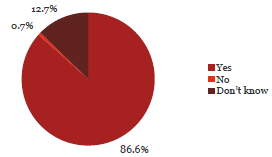
20. When fraud or corruption risks are raised at my organisation, my organisation takes proactive steps to reduce the risk.
Observation:

86.6% of respondents say their organisation takes proactive steps to reduce fraud risk.
This view was shared by senior managers and staff alike and across all sectors.
What some respondents have said:
“Our CEO is proactive on these matters and he reminds staff about the need for staying alert to fraud and corruption issues regularly at staff meetings.”
“I believe the risks for this organisation are very low, we are a medium size business with a large number of transactions being processed through automated approval system with approved suppliers.”
“We run electronic detection software over accounts payable and payroll data on a regular basis searching for irregularities and fraud.”
“We do work on a high trust model. But I think there are enough checks in place through audit and the Finance person on the Board and Our school Manager and accounts person.”
“We have checks in place by separate staff in most areas where fraud could occur. We also are audited each year by Audit NZ. We have reduced the number of solo roles and have backup people to carry out everyone's jobs except for one position which we also intend to ensure that person does not hold all the intellectual information alone.”
| Yes | No | Don’t know | Total Count | ||||
|---|---|---|---|---|---|---|---|
| Chief Executive Officer/Managing Director/Principal | 359 | 94% | 1 | 0% | 23 | 6% | 383 |
| Member of the senior executive/leadership team or equivalent | 453 | 92% | 4 | 1% | 33 | 7% | 490 |
| Line manager (if not one of the above) | 161 | 74% | 3 | 1% | 55 | 25% | 219 |
| Administration/Support Services | 167 | 84% | 1 | 1% | 32 | 16% | 200 |
| Operational staff (e.g. Teacher, Analyst, Advisor, Technician, Officer, Engineer, Accountant) | 96 | 71% | 1 | 1% | 39 | 29% | 136 |
| Other (please specify) | 1,236 | 87% | 10 | 1% | 182 | 13% | 1,428 |
| Yes | No | Don’t know | Total Count | ||||
|---|---|---|---|---|---|---|---|
| Central Government | |||||||
| Autonomous Crown Entities | 51 | 94% | 0 | 0% | 3 | 6% | 54 |
| Central Government - Other | 45 | 100% | 0 | 0% | 0 | 0% | 45 |
| Crown Agents or Companies | 84 | 97% | 1 | 1% | 2 | 2% | 87 |
| Crown Research Institutes | 37 | 97% | 0 | 0% | 1 | 3% | 38 |
| District Health Boards | 55 | 79% | 1 | 1% | 14 | 20% | 70 |
| Government Departments | 134 | 92% | 2 | 1% | 9 | 6% | 145 |
| Independent Crown Entities | 35 | 95% | 0 | 0% | 2 | 5% | 37 |
| Māori Trust Boards | 10 | 91% | 1 | 9% | 0 | 0% | 11 |
| Rural Education Activities Programmes | 11 | 100% | 0 | 0% | 0 | 0% | 11 |
| State-Owned Enterprises | 46 | 98% | 0 | 0% | 1 | 2% | 47 |
| Tertiary Education Institutions | 87 | 96% | 0 | 0% | 4 | 4% | 91 |
| Sub-Total | 595 | 94% | 5 | 1% | 36 | 6% | 636 |
| Yes | No | Don’t know | Total Count | ||||
|---|---|---|---|---|---|---|---|
| Local Government | |||||||
| Airports | 14 | 74% | 0 | 0% | 5 | 26% | 19 |
| Council Controlled Organisations or Council Controlled Trading Organisations | 62 | 83% | 1 | 1% | 12 | 16% | 75 |
| Energy Companies | 25 | 89% | 0 | 0% | 3 | 11% | 28 |
| Fish and Game Councils | 8 | 100% | 0 | 0% | 0 | 0% | 8 |
| Licensing and Community Trusts | 8 | 89% | 0 | 0% | 1 | 11% | 9 |
| Local Authorities | 145 | 86% | 3 | 2% | 21 | 12% | 169 |
| Local Government - Other | 9 | 82% | 0 | 0% | 2 | 18% | 11 |
| Port Companies | 2 | 100% | 0 | 0% | 0 | 0% | 2 |
| Sub-Total | 273 | 85% | 4 | 1% | 44 | 14% | 321 |
| Schools | 422 | 90% | 4 | 1% | 44 | 9% | 470 |
| Total | 1,236 | 87% | 10 | 1% | 182 | 13% | 1,428 |

