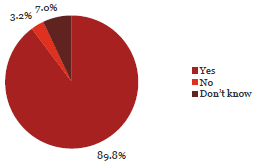
21. Credit card expenditure is closely monitored.
Observation:

89.8% of respondents said credit card expenses are closely monitored in their organisation.
This view was shared by senior managers and staff alike and across all sectors.
What some respondents have said:
“Credit card and staff expenses are monitored closely and any irregularities followed up with the employee concerned. Where appropriate, monies are recovered, however while the employee concerned may be advised of the inappropriateness of their behaviour, it may not always lead to formal disciplinary actions.”
“The school doesn't have credit cards, the only staff member with an expenses type account is the Principal that is monitored and reviewed as are all department expenses they are cross checked and signed off by 3 staff members.”
| Yes | No | Don’t know | Total Count | ||||
|---|---|---|---|---|---|---|---|
| Chief Executive Officer/Managing Director/Principal | 346 | 91% | 26 | 7% | 10 | 3% | 382 |
| Member of the senior executive/leadership team or equivalent | 468 | 96% | 5 | 1% | 16 | 3% | 489 |
| Line manager (if not one of the above) | 193 | 88% | 3 | 1% | 23 | 11% | 219 |
| Administration/Support Services | 166 | 83% | 10 | 5% | 24 | 12% | 200 |
| Operational staff (e.g. Teacher, Analyst, Advisor, Technician, Officer, Engineer, Accountant) | 107 | 79% | 2 | 1% | 27 | 20% | 136 |
| Total | 1,280 | 90% | 46 | 3% | 100 | 7% | 1,426 |
| Yes | No | Don’t know | Total Count | ||||
|---|---|---|---|---|---|---|---|
| Central Government | |||||||
| Autonomous Crown Entities | 51 | 94% | 0 | 0% | 3 | 6% | 54 |
| Central Government - Other | 45 | 100% | 0 | 0% | 0 | 0% | 45 |
| Crown Agents or Companies | 84 | 97% | 1 | 1% | 2 | 2% | 87 |
| Crown Research Institutes | 37 | 97% | 0 | 0% | 1 | 3% | 38 |
| District Health Boards | 55 | 79% | 1 | 1% | 14 | 20% | 70 |
| Government Departments | 134 | 92% | 2 | 1% | 9 | 6% | 145 |
| Independent Crown Entities | 35 | 95% | 0 | 0% | 2 | 5% | 37 |
| Māori Trust Boards | 10 | 91% | 1 | 9% | 0 | 0% | 11 |
| Rural Education Activities Programmes | 11 | 100% | 0 | 0% | 0 | 0% | 11 |
| State-Owned Enterprises | 46 | 98% | 0 | 0% | 1 | 2% | 47 |
| Tertiary Education Institutions | 87 | 96% | 0 | 0% | 4 | 4% | 91 |
| Sub-Total | 595 | 94% | 5 | 1% | 36 | 6% | 636 |
| Yes | No | Don’t know | Total Count | ||||
|---|---|---|---|---|---|---|---|
| Local Government | |||||||
| Airports | 16 | 84% | 0 | 0% | 3 | 16% | 19 |
| Council Controlled Organisations or Council Controlled Trading Organisations | 73 | 97% | 0 | 0% | 2 | 3% | 75 |
| Energy Companies | 25 | 89% | 0 | 0% | 3 | 11% | 28 |
| Fish and Game Councils | 8 | 100% | 0 | 0% | 0 | 0% | 8 |
| Licensing and Community Trusts | 7 | 78% | 1 | 11% | 1 | 11% | 9 |
| Local Authorities | 150 | 89% | 2 | 1% | 17 | 10% | 169 |
| Local Government - Other | 9 | 82% | 1 | 9% | 1 | 9% | 11 |
| Port Companies | 2 | 100% | 0 | 0% | 0 | 0% | 2 |
| Sub-Total | 290 | 90% | 4 | 1% | 27 | 8% | 321 |
| Schools | 395 | 84% | 37 | 8% | 37 | 8% | 469 |
| Total | 1,280 | 90% | 46 | 3% | 100 | 7% | 1,426 |

