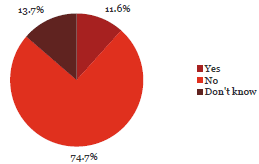
19. There is a whistleblower hotline at my organisation.
Observation:

74.7% of respondents said that their organisation did not have a whistleblower hotline.
The lack of a whistleblower hotline was reflected across all roles and levels of organisations and all sectors.
Organisations with a whistleblower hotline reported more instances of fraud. Of those that answered “Yes” to this question, 38% reported instances of fraud in the past 2 years, compared with 21% of those that answered “No”.
What some respondents have said:
“There haven't been any whistleblower, theft or fraud cases surface in the three years I have been in the organisation.”
“While there is not a whistleblower hotline, there are nominated staff in the policy that can be approached to raise issues under this policy.”
“While we do not have a "whistle blower" hot line we have a Protected Disclosure Policy that sets out the approach for staff that may have the need to lodge a formal compliant.”
“We are a small organisation and some processes such as whistle blower hotline are not necessarily needed.”
“Too small to have a whistleblower hotline - but all staff have access to the chairman and Board directors, including work and cell-phones and also can access them anonymously.”
“Current policy on protected disclosure is in draft form. Hotline is though Crimestoppers dedicated line but would hope that internal reporting policy will be the primary route for disclosure.”
| Yes | No | Don’t know | Total Count | ||||
|---|---|---|---|---|---|---|---|
| Chief Executive Officer/Managing Director/Principal | 45 | 12% | 320 | 84% | 18 | 5% | 383 |
| Member of the senior executive/leadership team or equivalent | 78 | 16% | 362 | 74% | 50 | 10% | 490 |
| Line manager (if not one of the above) | 23 | 11% | 153 | 70% | 43 | 20% | 219 |
| Administration/Support Services | 16 | 8% | 142 | 71% | 42 | 21% | 200 |
| Operational staff (e.g. Teacher, Analyst, Advisor, Technician, Officer, Engineer, Accountant) | 4 | 3% | 90 | 66% | 42 | 31% | 136 |
| Total | 166 | 12% | 1067 | 75% | 195 | 14% | 1,428 |
| Yes | No | Don’t know | Total Count | ||||
|---|---|---|---|---|---|---|---|
| Central Government | |||||||
| Autonomous Crown Entities | 8 | 15% | 42 | 78% | 4 | 7% | 54 |
| Central Government - Other | 3 | 7% | 35 | 78% | 7 | 16% | 45 |
| Crown Agents or Companies | 11 | 13% | 64 | 74% | 12 | 14% | 87 |
| Crown Research Institutes | 8 | 21% | 28 | 74% | 2 | 5% | 38 |
| District Health Boards | 11 | 16% | 43 | 61% | 16 | 23% | 70 |
| Government Departments | 20 | 14% | 93 | 64% | 33 | 23% | 146 |
| Independent Crown Entities | 1 | 3% | 29 | 78% | 7 | 19% | 37 |
| Māori Trust Boards | 0 | 0% | 11 | 100% | 0 | 0% | 11 |
| Rural Education Activities Programmes | 0 | 0% | 11 | 100% | 0 | 0% | 11 |
| State-Owned Enterprises | 9 | 19% | 29 | 62% | 9 | 19% | 47 |
| Tertiary Education Institutions | 22 | 24% | 53 | 58% | 16 | 18% | 91 |
| Sub-Total | 93 | 15% | 438 | 69% | 106 | 17% | 637 |
| Yes | No | Don’t know | Total Count | ||||
|---|---|---|---|---|---|---|---|
| Local Government | |||||||
| Airports | 1 | 5% | 13 | 68% | 5 | 26% | 19 |
| Council Controlled Organisations or Council Controlled Trading Organisations | 10 | 13% | 59 | 79% | 6 | 8% | 75 |
| Energy Companies | 6 | 21% | 21 | 75% | 1 | 4% | 28 |
| Fish and Game Councils | 0 | 0% | 7 | 88% | 1 | 13% | 8 |
| Licensing and Community Trusts | 0 | 0% | 9 | 100% | 0 | 0% | 9 |
| Local Authorities | 22 | 13% | 128 | 76% | 19 | 11% | 169 |
| Local Government - Other | 0 | 0% | 11 | 100% | 0 | 0% | 11 |
| Port Companies | 0 | 0% | 2 | 100% | 0 | 0% | 2 |
| Sub-Total | 39 | 12% | 250 | 78% | 32 | 10% | 321 |
| Schools | 34 | 7% | 379 | 81% | 57 | 12% | 470 |
| Total | 166 | 12% | 1,067 | 75% | 195 | 14% | 1,428 |

