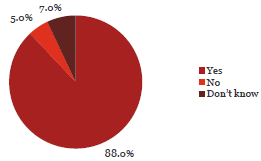
16. My organisation encourages staff to come forward if they see or suspect fraud or corruption.
Observation:

88% of respondents said their organisation encouraged staff to come forward if they see or suspect fraud.
Confidence was high across all positions and sectors that organisations did encourage staff to come forward and report their concerns for fraud.
What some respondents have said:
“I'm not aware of all of the options for reporting fraud, but it's not something I've ever seen here and so I'm not overly concerned about it. If I was concerned about something I think that I would feel comfortable expressing my concerns.”
“Clique management culture discourages detection or reporting.”
| Yes | No | Don’t know | Total Count | ||||
|---|---|---|---|---|---|---|---|
| Chief Executive Officer/Managing Director/Principal | 361 | 94% | 7 | 2% | 15 | 4% | 383 |
| Member of the senior executive/leadership team or equivalent | 437 | 89% | 22 | 4% | 32 | 7% | 491 |
| Line manager (if not one of the above) | 179 | 82% | 20 | 9% | 20 | 9% | 219 |
| Administration/Support Services | 174 | 87% | 11 | 6% | 15 | 8% | 200 |
| Operational staff (e.g. Teacher, Analyst, Advisor, Technician, Officer, Engineer, Accountant) | 107 | 78% | 12 | 9% | 18 | 13% | 137 |
| Total | 1,258 | 88% | 72 | 5% | 100 | 7% | 1,430 |
| Yes | No | Don’t know | Total | ||||
|---|---|---|---|---|---|---|---|
| Central Government | |||||||
| Autonomous Crown Entities | 49 | 91% | 5 | 9% | 0 | 0% | 54 |
| Central Government - Other | 40 | 89% | 3 | 7% | 2 | 4% | 45 |
| Crown Agents or Companies | 78 | 90% | 4 | 5% | 5 | 6% | 87 |
| Crown Research Institutes | 35 | 92% | 1 | 3% | 2 | 5% | 38 |
| District Health Boards | 60 | 86% | 5 | 7% | 5 | 7% | 70 |
| Government Departments | 125 | 86% | 6 | 4% | 15 | 10% | 146 |
| Independent Crown Entities | 31 | 84% | 2 | 5% | 4 | 11% | 37 |
| Māori Trust Boards | 9 | 82% | 1 | 9% | 1 | 9% | 11 |
| Rural Education Activities Programmes | 11 | 100% | 0 | 0% | 0 | 0% | 11 |
| State-Owned Enterprises | 39 | 83% | 2 | 4% | 6 | 13% | 47 |
| Tertiary Education Institutions | 79 | 87% | 7 | 8% | 5 | 5% | 91 |
| Sub-Total | 556 | 87% | 36 | 6% | 45 | 7% | 637 |
| Yes | No | Don’t know | Total | ||||
|---|---|---|---|---|---|---|---|
| Local Government | |||||||
| Airports | 16 | 84% | 0 | 0% | 3 | 16% | 19 |
| Council Controlled Organisations or Council Controlled Trading Organisations | 65 | 87% | 4 | 5% | 6 | 8% | 75 |
| Energy Companies | 26 | 93% | 2 | 7% | 0 | 0% | 28 |
| Fish and Game Councils | 7 | 88% | 1 | 13% | 0 | 0% | 8 |
| Licensing and Community Trusts | 9 | 100% | 0 | 0% | 0 | 0% | 9 |
| Local Authorities | 148 | 88% | 9 | 5% | 12 | 7% | 169 |
| Local Government - Other | 10 | 91% | 1 | 9% | 0 | 0% | 11 |
| Port Companies | 2 | 67% | 1 | 33% | 0 | 0% | 3 |
| Sub-Total | 283 | 88% | 18 | 6% | 21 | 7% | 322 |
| Schools | 419 | 89% | 18 | 4% | 34 | 7% | 471 |
| Total | 1,258 | 88% | 72 | 5% | 100 | 7% | 1,430 |

